![]()
PR-483
Home | Introduction | Horticultural Crops | Marketing and Economics | Specialty Grains
MARKETING AND ECONOMICS
Matt Ernst and Tim Woods, Department of Agricultural Economics
Expansion of commercial vegetable production in Kentucky prompted the updating of the 1998 commercial vegetable budget estimates for Kentucky's major commercial vegetables in 2000. Updates continued throughout subsequent seasons. These estimated returns to land, labor, and management sought to convey a conservative profitability estimate for comparative purposes among existing and potential commercial vegetable producers. A copy of current budget estimates can be found at this Web site: <http://www.uky.edu/Ag/NewCrops/2003veggiebudgets.pdf>.
Return to land, capital, labor, and management is defined as the return above variable and fixed production costs incurred during the production year. Variable production costs include cash costs incurred in crop production such as seed, fertilizer, harvest labor, packaging, marketing, and pesticides. Fixed production costs include non-cash costs incurred in vegetable crop production such as depreciation on machinery and irrigation equipment.
The estimated returns are listed in Table 1. It should be noted that vegetable production practices and costs vary throughout different regions of the state. Therefore, these estimated returns are best used as a guide for simply comparing profitability between crops. It should also be noted that these estimates are based on wholesale prices received by the producer. Producers utilizing on-farm retail or other direct marketing strategies can usually expect significantly greater returns per acre.
These budget estimates are updated annually to reflect changes in production practices, annual seasonal average price fluctuations, and changes in input costs specific to an individual crop. The following discussion describes price trends and other reasons for changes in the 2002 numbers.
Wholesale cabbage markets are expected to rebound after soft markets in 2002 decreased average returns per acre. High-quality fresh cabbage production remains a viable part of Kentucky's commercial vegetable industry. Cabbage is a crop that has increased profitability potential for producers and producer groups willing to invest in shredding and other value-added processing activities.
Cantaloupe prices were down in 2002, leading to a significantly lower profitability estimate. However, many Kentucky cantaloupe producers realized similar returns in previous years. University estimates were adjusted to reflect significantly greater marketing costs, leading to lower return estimates for 2002. Cantaloupe production will remain extremely profitable for Kentucky producers in the future.
Commercial sweet corn production is centered in the Owensboro area (West Kentucky Growers Co-op). Sweet corn profitability estimates have been down due primarily to lower market prices during the past two years. Because these budgets are intended to reflect statewide standards, they do not include the higher value tray-pack product produced by the co-op. This tray-pack product enabled producers there to recover profitable production in 2002 after viciously low sweet corn prices in 2001.
Cucumbers remain a commercial vegetable staple in Kentucky. Producers, especially in the western part of the state, have realized that fall cucumber production on trellis systems may add significantly to the crop's profitability.
Commercial eggplant production is limited in the state. Eggplant remains profitable for those able to capture this smaller market.
Behind staked tomatoes, peppers are Kentucky's most profitable widespread commercial vegetable crop. Budget yield assumptions were changed in 2001 to reflect yield levels more commonly reported throughout the state. Strong markets in 2003 suggest continued pepper profitability.
Specialty (jalapeño, anaheim, serrano, poblano, yellow chile) peppers are also emerging as a highly profitable crop for producers who have created access to these wholesale markets. Expanded specialty pepper production could occur as more markets open to the state's producers.
University budget estimates are for non-irrigated pumpkin production. Wholesale pumpkin production usually produces returns slightly above row crops, making pumpkins a good "entry" crop for producers new to commercial vegetable production. Kentucky faces significant regional competition from Tennessee in commercial pumpkin production.
University estimates are for yellow crookneck varieties. Some producers are expanding into larger production of straight-necked and zucchini varieties. Market timing is crucial for summer squash profitability.
Fresh tomatoes continue to lead the way in profitability for Kentucky's commercial vegetable producers. Estimated returns have increased due to more efficient production and yield increases throughout the state. Tomato budgets assume significantly greater operator labor than any other vegetable budget (Table 2).
Commercial watermelon production is becoming profitable in Kentucky. Although acreage is limited, watermelon profitability should remain strong. Increased production of seedless varieties should add greater value to overall watermelon production.
| Table 1. Estimated returns to operator land, capital, labor, and management. | ||||
| 1998 | 2000 | 2001 | 2002 | |
| Cabbage, Green | 965.95 | 1,296.56 | 691.54 | 691.77 |
| Cantaloupe | 2,210.24 | 1,469.18 | 1,410.21 | 889.08 |
| Corn, Sweet | 628.43 | 244.25 | -89.02 | -13.12 |
| Cucumbers | -873.72 | 151.46 | 439.84 | 249.88 |
| Cucumbers, Fall Trellis Production | -- | -- | -- | 472.92 |
| Eggplant | 1,471.45 | 710.89 | 959.45 | 967.65 |
| Peppers, Bell | 927.83 | 932.34 | 2,167.71 | 3,632.90 |
| Peppers, Jalapeño | -- | -- | 2,421.41 | 2,428.13 |
| Pumpkins (non-irrigated) | 209.30 | 387.61 | 345.23 | 355.87 |
| Squash, Yellow Crookneck | 166.47 | 185.51 | 600.92 | 598.93 |
| Tomatoes, Staked | 1,917.91 | 2,261.24 | 3,872.59 | 3,883.78 |
| Watermelons, Seeded | 257.85 | -103.95 | 147.09 | 149.77 |
| Watermelons, Seedless | -- | 357.57 | 325.78 | 538.98 |
| Table 2. Assumed operator labor hours per crop, 2002. | |
| Labor Hours | |
| Cabbage, Green | 50 |
| Cantaloupe | 50 |
| Corn, Sweet | 20 |
| Cucumbers | 20 |
| Cucumbers, Fall Trellis Production | 20 |
| Eggplant | 52 |
| Peppers, Bell | 40 |
| Peppers, Jalapeño | 40 |
| Pumpkins (non-irrigated) | 20 |
| Squash, Yellow Crookneck | 20 |
| Tomatoes, Staked | 220 |
| Watermelons, Seeded | 30 |
| Watermelons, Seedless | 30 |
Matt Ernst and Tim Woods, Department of Agricultural Economics
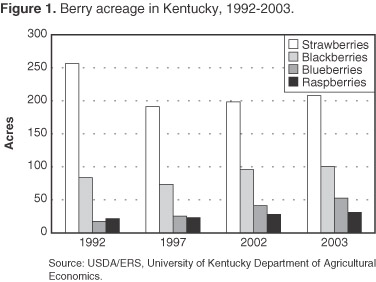
Berries can be a consistently higher-profit new crop for Kentucky producers willing to invest the time, capital, and other resources required for their establishment. A significant increase in blueberry acreage, combined with slight increases in other berry acreages, has made more fresh Kentucky berries available for markets (Figure 1). This report will highlight estimated returns and establishment costs for blackberries and blueberries in Kentucky.
Blackberries are one of the main crops targeted by the New Crop Opportunities Center research initiative. Estimated establishment costs and profitability estimates for blackberry production in Kentucky were completed in 2001. There have been no significant changes in recommended blackberry production practices in Kentucky since the 2001 budget estimates with one exception: the phaseout of Benlate, the fungicide used in controlling double rosette disease in blackberries. Control of this disease in the future could potentially result in substantial additional cost through crop loss to producers.
Establishment costs for Kentucky blackberries vary by variety (Table 1). The main variables in blackberry establishment costs are plant cost and trellis cost. Thorny blackberry varieties, which require no trellis, are assumed to be planted at a population of 1,815 root pieces at a cost of approximately $0.15/piece, a total of $272.25 per acre. Thornless semi-erect varieties require a substantially greater plant investment of $600 per acre. Thornless erect varieties are similar to semi-erect varieties in cost per plant. However, thornless erect varieties are planted at a substantially greater population than semi-erect varieties for an estimated plant cost of $1,400 per acre.
The other main variable in establishment cost is due to the cost of the trellis required for blackberry production. Thorny varieties do not require a trellis for production. Thornless erect varieties require a high trellis, estimated to cost approximately $1,400 per acre, and thornless semi-erect varieties require a low trellis estimated to cost approximately $500 per acre.
The variation in blackberry establishment costs between different varieties contributes to differences in long-term profitability. However, yield differences between the varieties also contribute to differences in profitability. The thornless semi-erect varieties were judged to return the greatest present value cash flow of all varieties over a five-year period ($6,569.33), followed by the thorny varieties ($5,374.03) and the thornless erect ($4,405.88). This is obviously due to the higher establishment costs for the thornless erect blackberry plants and trellis system.
There is one factor concerning blackberry variety profitability that is not directly factored into this financial discussion. Thornless erect berries are larger and sweeter than the other varieties and tend to be greatly preferred by consumers looking for a larger, sweeter berry. It is very likely that thornless erect berries could command a price premium over other varieties in some areas of Kentucky. Since the price was assumed to be the same for all varieties in this analysis, producers able to capture a higher price for thornless erect berries should capture a similar rate of return on their investment as that projected for the semi-erect varieties.
Blackberries are proven to be a potentially profitable new crop for Kentucky producers willing to invest the time, money, and patience into producing and marketing blackberries in Kentucky. As with any new crop, potential blackberry producers should identify their target market and consumer preferences before establishing the crop. Future research needs into the economics of blackberry production in Kentucky include identifying demand and economic viability for U-Pick/PYO blackberry production and exploring returns from other potential market channels.
Blueberries are emerging as a crop with excellent profitability potential for Kentucky producers willing to invest the time, capital, and management into establishing well-managed blueberry acreage. Blueberries have the advantage of having lower establishment costs than other berry crops that require trellis systems for production. Once established, properly managed blueberry bushes can produce for many years.
Detailed blueberry production budgets were developed during 2002 to analyze potential profitability of blueberries in Kentucky. These budgets can be viewed at this Web site: <http://www.uky.edu/Ag/NewCrops/decision.html>. Two sets of budgets were developed: on-farm retail/wholesale and Pick Your Own (PYO).
The budget estimates indicate that the PYO system will be more profitable for producers willing to utilize this market in the long run (Table 3). However, producers need to be aware of additional liability risks incurred when conducting on-farm retail activities such as PYO. These risks are best identified during a personal visit with your insurance agent to determine what additional coverage you may need on your farm.
The major establishment costs for blueberries are the cost of the plants and the cost of preparing the land where they will be planted. Blueberries are extremely sensitive to soil pH, requiring a pH of 4.5 to 5.5 for optimal production. The pH of many soils in Kentucky will need to be adjusted for commercial-level blueberry production. A $650 cost for materials (sulfur) for this practice is budgeted for both production systems. These budget details can be viewed at this Web site: <http://www.uky.edu/Ag/NewCrops/decision.html>.
After a five-year payback period, properly established and managed blueberries can yield high returns for producers in Kentucky. Many Kentucky producers are able to command top price for their blueberries in both wholesale and retail markets (Table 4). Blueberries using hand harvest are a very labor-intensive crop, with the best pickers averaging 20 to 25 pints per hour on larger-size berries. Producers able to adjust to Pick Your Own marketing will eliminate the considerable expense of harvest and maximize the returns on their investment in blueberries (Table 5).
| Table 1. Selected establishment costs (years 1-3) for 1-acre blackberries, Kentucky, 2001. | ||||
| Variety | Assumed Plant Population (plants) | Estimated Plant Cost ($) | Approximate Trellis Material Cost ($) | Total Establishment Costs ($) |
| Thorny | 1,815 | 272 | 0 | 4,778.76 |
| Thornless Erect | 1,210 | 1,452 | 1,400 | 7,570.55 |
| Thornless Semi-Erect | 500 | 600 | 500 | 5,813.11 |
| Table 2. Estimated blackberry yields and returns. | ||||
| Variety | Total Establishment Costs ($) | Yield, Quarts Full Bearing (Year 5) | Return to Management, Year 5 ($) | 5-Year Return to Management |
| Thorny | 4,778.76 | 5,000 | 4,905.32 | 5,374.03 |
| Thornless Erect | 7,570.55 | 5,000 | 4,885.98 | 4,405.88 |
| Thornless Semi-Erect | 5,813.11 | 6,000 | 6,328.39 | 6,569.33 |
| Table 3. Estimated blueberry profitability for 1 acre (8,500 pints in full production year). | |||||
| System | Estimated Establishment Cost (cash outlays until positive cash flows are generated) | Estimated Annual Return to Owner Land, Labor, and Management (full production) | Estimated Present Value of 10-Year Cumulative Return (9% discount rate) | Estimated Payback Period (owner land, labor & mgt.) | |
| Wholesale/Retail $1.50/pt | $4,811 | $5,873 | $12,010 | 5 years | |
| Pick Your Own (PYO) 80% @ $1.25/pt 20% @ $1.50/pt | $4,598 | $8,325* | $22,840 | 5 years | |
| * | PYO return assumes owner/operator supervision of PYO customers. | ||||
| Table 4. Estimated on-farm retail/wholesale blueberry profitability at varying prices and yields: $/A return to owner land, labor, and management—full production year. | |||||||
| Price/Pint | Yield (Pints) | ||||||
| 7,000 | 7,500 | 8,000 | 8,500 | 9,000 | 9,500 | 10,000 | |
| $0.70 | -436 | -363 | -289 | -216 | -143 | -70 | 3 |
| $0.80 | 191 | 309 | 427 | 545 | 663 | 781 | 898 |
| $0.90 | 818 | 981 | 1,143 | 1,306 | 1,469 | 1,631 | 1,794 |
| $1.00 | 1,445 | 1,652 | 1,860 | 2,067 | 2,275 | 2,482 | 2,689 |
| $1.10 | 2,072 | 2,324 | 2,576 | 2,828 | 3,081 | 3,333 | 3,585 |
| $1.20 | 2,700 | 2,996 | 3,293 | 3,590 | 3,886 | 4,183 | 4,480 |
| $1.30 | 3,326 | 3,667 | 4,009 | 4,351 | 4,692 | 5,034 | 5,376 |
| $1.40 | 3,952 | 4,339 | 4,725 | 5,112 | 5,498 | 5,885 | 6,271 |
| $1.50 | 4,579 | 5,011 | 5,442 | 5,873 | 6,304 | 6,736 | 7,167 |
| $1.60 | 5,206 | 5,682 | 6,158 | 6,634 | 7,110 | 7,586 | 8,062 |
| $1.70 | 5,833 | 6,354 | 6,875 | 7,395 | 7,916 | 8,437 | 8,958 |
| $1.80 | 6,460 | 7,025 | 7,591 | 8,157 | 8,722 | 9,288 | 9,853 |
| Table 5. Pick your own blueberry profitability at varying prices and yields: $/A return to owner land, labor & management—full production year. Assumes 80% production goes to PYO, 20% to retail/wholesale. | |||||||
| $1.00/Pint Wholesale | Total Yield (Pints) | ||||||
| PYO Price/Pint | 7,000 | 7,500 | 8,000 | 8,500 | 9,000 | 9,500 | 10,000 |
| $0.75 | 3,304 | 3,635 | 3,966 | 4,297 | 4,628 | 4,959 | 5,290 |
| $1.00 | 4,631 | 5,057 | 5,483 | 5,908 | 6,334 | 6,760 | 7,186 |
| $1.25 | 5,958 | 6,478 | 6,999 | 7,520 | 8,040 | 8,561 | 9,081 |
| $1.50 | 7,285 | 7,900 | 8,515 | 9,131 | 9,746 | 1,0361 | 1,0977 |
| $1.75 | 8,612 | 9,322 | 10,032 | 10,742 | 11,452 | 12,162 | 12,872 |
| $1.50/Pint Wholesale PYO Price/Pint | 7,000 | 7,500 | 8,000 | 8,500 | 9,000 | 9,500 | 10,000 |
| 0.75 | 3,967 | 4,346 | 4,724 | 5,103 | 5,481 | 5,860 | 6,238 |
| 1.00 | 5,294 | 5,768 | 6,241 | 6,714 | 7,187 | 7,660 | 8,134 |
| 1.25 | 6,621 | 7,189 | 7,757 | 8,325 | 8,893 | 9,461 | 10,029 |
| 1.50 | 7,948 | 8,611 | 9,274 | 9,936 | 10,599 | 11,262 | 11,925 |
| 1.75 | 9,275 | 10,032 | 10,790 | 11,547 | 12,305 | 13,063 | 13,820 |
Matt Ernst and Tim Woods, Department of Agricultural Economics
Market surveys were completed during the summers of 2002 and 2003 to evaluate consumer preferences for fresh blueberries grown in Kentucky. The surveys were conducted to specifically provide market information on consumer buying habits, preferences, and willingness to pay for various container sizes. Product use, bulk purchase capacity, and interest in pick-your-own (PYO) blueberries were also explored.
Consumers were evaluated at both a retail supermarket and a farmers' market. The 2003 survey focused especially on willingness to pay for PYO production. Materials for both surveys were sponsored by the New Crop Opportunities Center at the University of Kentucky, with additional funding in 2003 from the Southern Region Sustainable Agriculture Research and Education Program.
According to this analysis, consumers in both small and big Kentucky towns continue to be willing to pay well above the grower break-even price for fresh, high-quality Kentucky blueberries in any size and kind of container. Consumers prefer berries to be packaged in a reusable/recyclable container. There also exists significant market potential in Central Kentucky for PYO blueberry marketing.
In 2002, a random survey of 137 blueberry buyers was conducted during the first two weeks of Kentucky's blueberry season. There were 112 surveys collected at the Lexington Farmers' Market and 25 surveys collected in Metcalfe County at the "Blueberry Festival" promotion that featured locally grown blueberries in the Edmonton CB Foods grocery store. This collection technique was repeated in 2003 with 102 consumers surveyed at the Lexington Farmers' Market and 27 customers surveyed at Edmonton.
The survey took less than two minutes to complete. It included questions about how much consumers were willing to pay that day for retail blueberries, what blueberries were being used for, whether the customer had freezer capacity, and how much customers would be willing to pay for U-Pick blueberries.
In 2002, Lexington Farmers' Market customers surveyed indicated that they would be willing to pay an average of $3.14 per pint of blueberries in season (Table 1). Consumers at the farmers' market were accustomed to paying $3.00 per pint for fresh blueberries. Most farmers' market customers, though, said that they were "probably" willing to pay whatever the market price happened to be for blueberries.
In Metcalfe County, some 150 miles southwest of Lexington, CB Foods featured local, handpicked blueberries for $1.88 per pint. CB Foods is a smaller retail grocer that agreed to feature local blueberries in their produce section. The consumers surveyed there on a Saturday indicated that they would be willing to pay, on average, $2.08 per pint for blueberries (Table 1). The "willingness to pay" question was not repeated in 2003.
The total additional amount that consumers would be willing to pay for a quart-size container of blueberries over the pint-size was observed to be largest in the farmers' market, an additional $2.34. This is 78% of the $3.00 price that customers were used to paying at the farmers' market (Table 1).
Wholesale prices for local berries at both these markets were well within the $1.25 to $2.00 price per pint that Kentucky's blueberry farmers received in 2002. Blueberry enterprise budget estimates from the University of Kentucky New Crop Opportunities Center show that blueberry growers can make adequate profits from blueberries at these wholesale price levels. Farmers' markets offer consistently higher demand but also have limited volume of product with fewer customers.
Growers who are willing to market their own berries at "premium" markets (like the farmers' market) can expect to generate significantly greater profits. Both wholesale and on-farm retail prices were up in 2003, with producers reporting continued strong demand. These prices are being paid by consumers who are almost exclusively using the blueberries purchased for fresh fruit consumption and some baking (Table 2).
Producers willing to tailor their production for PYO/U-Pick markets can often capture higher profits than wholesale producers. This is because PYO eliminates labor costs, the largest cost for wholesale blueberry production. In fact, according to university estimates, those willing to develop a PYO blueberry market in their area can make $800 to $1,500 more per acre over wholesale berry production when charging a price of $1.25 per pint.
The survey indicated over both years that about half the consumers at both markets would be interested in picking their own berries at a nearby farm. Lexington Farmers' Market customers said that they would pay an average of $2.13 and $2.19 per pint in 2002 and 2003, respectively, for berries that they picked themselves (Table 3). Those surveyed at the Metcalfe County grocery indicated that they would be willing to pay considerably less, $1.24 and $1.19 per pint, for U-Pick blueberries (Table 3).
Lexington consumers were, on average, willing to drive considerably farther than were Metcalfe County consumers to pick blueberries (Table 4). This indicates drawing potential for potential PYO blueberry marketers in areas within 30 miles of Lexington. Metcalfe County consumers, on the other hand, have closer access to blueberry farms and would naturally be less likely to travel farther to pick their own blueberries.
Interestingly, some of those surveyed at the Lexington Farmers' Market during both years indicated that they would be willing to pay more than they were paying at the market just to go to a farm and pick their own berries. Therefore, enterprising farmers willing to provide a hospitable and entertaining environment for U-Pick berry customers may be able to capture additional profits.
Research in Kentucky small fruit marketing has indicated that container size and type can contribute significantly to berry sales. One simple way to present a more "consumer-friendly" berry product is to market berries in containers that are easily recyclable. These include #1 PETE plastic clamshell containers and paperboard/chipboard containers.
In 2003, consumers were asked how important it was to them that "the containers you purchased berries in are recyclable." Consumers at the Lexington Farmers' Market placed significant importance on this, with 85% of the respondents indicating that this was important to very important. Consumers in Metcalfe County also considered this significantly important, with 67% responding that recyclable berry containers were important or very important.
Finally, it was observed that the bulk of blueberry customers at the Lexington Farmers' Market purchased less than a quart of blueberries in 2003. In fact, only one customer during the three-week period of 102 random surveys in 2003 indicated they had purchased more than a quart.
Using funds from a Southern Region Sustainable Agriculture Research and Education Program grant for Kentucky blueberry market development, three-pint specialty baskets were purchased for test marketing at the Lexington Farmers' Market. Ten of these baskets, some including recipes attached, were sold over a two-week period. This indicates that attractive packaging can increase berry volume at even the most lucrative of Kentucky berry markets.
Kentucky's blueberry acreage has doubled to 40 acres since 1997 and is expected to double again to 80 acres by 2005. Statewide demand should easily support this acreage increase. Furthermore, these surveys indicate that consumers appear to be willing to pay top prices for fresh, high-quality Kentucky-grown blueberries. This consumer willingness to pay for blueberries should ensure adequate profits for those producers willing to invest the necessary time and capital into this "new" crop for Kentucky. Future research in this area could focus on consumer preference for organic blueberries, value-added products, and potential for bulk berry purchases.
A complete report of these surveys is available online at: <www.uky.edu/ag/hortbiz>.
| Table 1. The MOST for blueberries that I would be willing to pay today (2002): | ||
| Lexington Average | Metcalfe County Average | |
| ½ pint is | $1.81 | $1.17 |
| 1 pint is | $3.14 | $2.08 |
| 1 quart is | $5.48 | $3.83 |
| Table 2. My primary use for the blueberries that I am purchasing today: | |||||
2002 |
2003 | ||||
| Lexington | Metcalfe County | Lexington | Metcalfe County | ||
| Baking (pies, muffins, etc.) | 20% | 50% | 15% | 44% | |
| Fresh fruit | |||||
| (fruit salad, fresh ingredient) | 88% | 54% | 93% | 52% | |
| Preserving (jam/jelly) | 6% | 8% | 1% | -- | |
| Other | 2% | 0% | -- | 15% | |
| Table 3. I would be interested in picking my own berries at a nearby farm. | |||||
| 2002 | 2003 | ||||
| Lexington | Metcalfe County | Lexington | Metcalfe County | ||
| Yes | 58% | 42% | 53% | 44% | |
| No | 42% | 58% | 47% | 56% | |
| $__/lb willing to pay for U-Pick | $2.13 | $1.24 | $2.19 | $1.19 | |
| Table 4. How far would you be willing to drive to pick berries at this price? (2003) | ||
| Lexington | Metcalfe County | |
| < 10 miles | 15% | 50% |
| 10-14.9 miles | 30% | 17% |
| 15-19.9 miles | 19% | 8% |
| 20-29.9 miles | 26% | 17% |
| > 29.9 miles | 11% | 8% |
| Table 5. How important is it to you that the containers you purchase berries in are recyclable? (2003) | ||
| Lexington | Metcalfe County | |
| Important or Very Important | 85% | 67% |
| Not Important | 15% | 33% |
Matt Ernst and Tim Woods, Department of Agricultural Economics
Kentucky's fresh produce industry has expanded at a 5 to 10% rate over the past five years. This growth has occurred through a variety of marketing channelsfarmers' markets, co-ops, roadside stands, vineyards, and the Fairview Produce Auction. A variety of producers are responsible for this growth, including full- and part-time farmers, farmers' market and auction vendors, organic and conventional producers, and wholesale and retail farmer-marketers.
Trends in marketing fresh produce in Kentucky, as well as the characteristics of those producers marketing the produce, were first evaluated through the 2002 Kentucky Produce Marketing Practices Survey (see University of Kentucky departmental Extension publication AEC-EXT 2002-05, Highlights from 2001/02 Kentucky Produce Marketing Surveys). This survey queried extensively the marketing practices of more than 300 Kentucky producers.
A shorter version of the 2002 survey was conducted in 2003. The 2003 survey again allowed evaluation of planting trends for the various produce crops in Kentucky and identified additional production and marketing trends among Kentucky producers. This report will summarize these data as collected during the winter of 2003. Specific data about 2003 produce planting intentions and produce acreage estimates can be found in the 2003 Kentucky Produce Planting Intentions and Outlook at this Web site: <http://www.uky.edu/Ag/AgEcon/publications/ext2003-02.pdf>.
The 2003 survey was mailed to 1,065 addresses throughout Kentucky. These addresses had been collected through contacting county Extension offices, produce cooperatives, the Kentucky Department of Agriculture, and farmers' markets. Approximately 7% (73) of the surveys mailed were unusable or were returned from addresses that did not market produce in 2002.
The survey was mailed as a single mailing with a follow-up postcard mailed approximately 10 days after the survey instrument. More than 30% (325) of the producers addressed returned surveys that contained information useful for analysis. This total, combined with those surveys returned as unusable, represents a 37.3 total response rate.
The producers surveyed in 2002 represented about 45% (2,600 acres) of commercial vegetable production in Kentucky. A detailed description of planting intentions generated from the data in this survey can be found in a previous departmental Extension publication, AEC-EXT 2003-02, Kentucky Produce Planting Intentions and Outlook.
A much lower percentage of fruit than vegetable producers responded to the survey. Only 500 (17%) of Kentucky's fruit acreage was represented. This is largely due to the lack of responses from some of Kentucky's larger orchards, which represent the bulk of the state's fresh fruit acreage.
The growers responding to the 2003 survey reveal similar age and experience demographics as growers who responded to the 2002 survey. Produce, like other farm crops in Kentucky, continues to be grown by an older farm population. Those responding to the 2003 survey were slightly older overall as compared to the 2002 sample (Table 1). Since the survey is random and anonymous, this does not necessarily indicate an aging of produce growers in Kentucky; rather, it merely indicates that 75 to 80% of the produce growers in Kentucky remain more than 40 years old.
The 2003 survey also indicates that Kentucky produce growers are relatively inexperienced in fruit and vegetable production (Table 2, Figure 1). Nearly half (48%) of those growers surveyed had been growing produce for six years or less. This is virtually identical to the 49% of growers who indicated they had been growing produce for six years or less in 2002. Producers in the 41 to 50 age category are the most likely to have begun growing produce in the past six years. This demographic indicates good potential for continued growth in Kentucky's commercial produce industry in the near future. Recruiting younger growers to replace an experienced grower base will be critical to sustaining growth in the Kentucky produce industry.
Organic fruit and vegetable production continues to be popular in Kentucky, especially in areas closest to the state's metropolitan centers (Lexington, Louisville, Northern Kentucky). Organic vegetable acreage made up 2% (50 acres) of the production area surveyed in 2002 and 2.4% (63 acres) of the area surveyed in 2003. This mirrors a slight increase (from 131 to 140 acres) in certified organic vegetable acreage statewide from 2002 to 2003.
Nearly 10% (31) of the 326 growers surveyed indicated that they produced some crops "organically" in 2002. (Note: the question did not distinguish between certified organic and declared organic vegetable crops). An additional 37 producers (11%) indicated that they are interested in organic production for the future. Some of these producers are former certified organic producers adjusting to new requirements; other producers have never grown organic produce and are interested in beginning.
Organic acreage should increase more rapidly in the future as growers become accustomed to revised requirements for organic certification. Kentucky produce growers continue to show strong interest in adopting organic production.
Many produce growers are also tobacco growers. Significantly more tobacco growers among those producers surveyed have utilized the County Agriculture Diversification Program to diversify their farm and expand their produce operations. Of the 140 tobacco growers responding to this survey, 75 growers (54%) indicated that they had participated in a County Agriculture Diversification Program. Only 29% (50 of 170) producers who do not grow tobacco on their farm indicated that they had participated in a County Agriculture Diversification Program (Table 3). Furthermore, several tobacco growers said that they would have participated in a County Agriculture Diversification Program if such a program were available in their county.
Two questions on the 2003 survey focused on producers' use of Pick Your Own (PYO) marketing in produce channels. Emphasis on developing crops suitable for PYO marketing in Kentucky, especially berries, may lead to more producer interest in this market channel. This survey offered an opportunity to evaluate the current use and potential for PYO production, as well as identify crops that these producers are growing.
A relative minority of Kentucky produce growers used PYO to market produce in 2002. Only 15% (47) of the producers responding to the survey's PYO questions indicated that they were currently using PYO. The most frequent crops that these producers report growing are strawberries, sweet corn, tomatoes, and pumpkins (Table 4). Future surveys will gauge what crops are being marketed using PYO; however, strawberries stand out as the leading crop.
Producers were also asked if they were interested in using PYO marketing in the future. Of the 47 producers currently using PYO, only one responded that they were planning on stopping this marketing practice. An additional 62 producers said that they would be interested in using PYO, while 12 more producers responded they "maybe" would be interested. This places the total percentage of those producers surveyed who are interested in PYO production at 34% (108 producers).
Interestingly, there appears to be a significant amount of interest among vegetable and melon producers concerning future use of PYO marketing. Of the top crops most frequently reported by growers who are interested in PYO production, strawberries and apples are the only small and tree fruits grown by 20 or more producers who are interested in PYO in the future (Table 5). This leads to two possibilities: 1) vegetable growers are interested in adding PYO fruit marketing; or 2) vegetable growers are interested in adding PYO vegetable production. Because vegetables are less frequently marketed as "U-Pick" crops, this interest may indicate a need for further information on this marketing channel targeted specifically for vegetable producers.
Produce growers in Kentucky reflect many levels of farm income. Half of those surveyed said that they had less than $20,000 in gross sales from farming in 2002 (Table 6). For many produce growers, especially those participating in farmers' markets, farm income serves as a supplement to their existing incomes.
The majority of producers surveyed (61%) also said that less than half their household income was derived from farming. The producers who derived more than 50% of their income from farming were most likely to fall into the $20,000-$49,999 produce sales range (Table 8). There were no significant changes in the percentage of those deriving more than half their income from farming in the 2003 survey compared to the 2002 survey. There were also no significant changes in the percentage of producers reporting more than $20,000 worth of produce sales in 2002 (26% compared to 27% for the 2001 season). Therefore, Kentucky farmers are continuing to view produce as another viable enterprise on their farming operation.
The three primary marketing channels for produce in Kentucky are cooperatives, farmers' markets, and on-farm direct markets (Table 7). These continue to be the major ways that produce growers marketed their produce in 2002. The interest in on-farm PYO marketing has already been documented in this report. However, there are at least two additional trends for produce marketing that should continue in the future.
Some Kentucky producers have worked to establish relationships with produce retailers over the past few years. Many more Kentucky producers reported sales to non-cooperative wholesalers in 2002. This trend should continue, particularly as producers in southern Kentucky explore the wholesale market for specialty herbs and vegetables to the Wal-Mart distribution center in London.
The Fairview Produce Auction continues to be a popular wholesale outlet for producers in southwest Kentucky. Producers responding to this survey appear to be using the auction more as a supplemental marketing source. However, there are many producers from the counties immediately surrounding the auction that utilize the auction to market all or nearly all their produce production.
The 2002/03 survey, like the 2001/02 survey, indicates that Kentucky's produce industry is continuing to expand. Producers are adopting and trying new crops and are investigating new market channels, especially more direct markets, to market new crops grown in Kentucky. Future producer surveys will seek to monitor specific acreage expansion and marketing trends to provide further basic information on the produce industry in Kentucky.
| Table 1. Age of producers surveyed (to nearest percent). | ||
| 2002 | 2003 | |
| Under 31 | 7% | 5% |
| 31-40 | 17% | 14% |
| 41-50 | 31% | 29% |
| 51-60 | 22% | 27% |
| Over 60 | 23% | 25% |
| Table 2. Age of producers with less than seven years experience growing produce (149 producers, 2003). | |||||
| Under 30 | 31-40 | 41-50 | 51-60 | 60+ | |
| Less than 3 years | 5 | 8 | 15 | 14 | 7 |
| 3-6 years | 6 | 18 | 36 | 25 | 15 |
| Table 3. Other characteristics of produce growers. | |||||
| Percent of Responding Produce Growers | 2002 | 2003 | |||
| Yes | No | Yes | No | ||
| Do you grow tobacco? | 44% | 56% | 45% | 55% | |
| Have you participated in a County Agriculture Diversification Program? | n/a | n/a | 41% | 59% | |
| Have you visited a university on-farm produce demonstration plot within the last three years? | n/a | n/a | 33% | 67% | |
| Table 4. Crops grown by producers using PYO marketing in 2002. | |
| Crop | No. of Producers Reporting PYO Marketing |
| Strawberries | 22 |
| Sweet Corn | 20 |
| Tomatoes | 19 |
| Pumpkins | 18 |
| Watermelons | 15 |
| Beans, Snap | 13 |
| Peppers, Bell | 13 |
| Apples | 13 |
| Cantaloupes | 12 |
| Cucumbers | 11 |
| Squash, Summer | 11 |
| Blackberries | 11 |
| Potatoes, White | 9 |
| Asparagus | 8 |
| Blueberries | 8 |
| Peaches | 8 |
| Table 5. Crops grown by producers interested in future PYO use. | |
| Crop | No. of Producers Interested in Future PYO Marketing |
| Tomatoes | 60 |
| Sweet Corn | 56 |
| Peppers, Bell | 46 |
| Beans, Snap | 44 |
| Pumpkins | 41 |
| Squash, Summer | 39 |
| Cucumbers, Fresh | 33 |
| Watermelons | 32 |
| Strawberries | 32 |
| Cabbage | 31 |
| Cantaloupes | 29 |
| Broccoli | 21 |
| Potatoes, White | 21 |
| Ornamental Vegetables | 20 |
| Apples | 20 |
| Table 6. Farm income reported by surveyed produce growers. | ||||||
| <$2,500 | $2,500-9,999 | $10,000-19,999 | $20,000-49,999 | $50,000-99,999 | >$100,000 | |
| Number of respondents | 58 | 55 | 42 | 54 | 45 | 55 |
| Table 7. Sales via specific market channels by number of producers responding. | |||||||
| Number of Producers by Percentage of Sales* | |||||||
| Percentage of Producer Sales | 100% | 50-99% | 25-50% | 10-25% | <10% | 0% | |
| Farmers’ Markets | 41 | 55 | 20 | 25 | 9 | 166 | |
| Other Direct Markets (roadside stands, PYO, on-farm, etc.) | 37 | 40 | 30 | 49 | 18 | 142 | |
| Direct-to-Retail (grocery, etc.) | 1 | 9 | 11 | 45 | 21 | 229 | |
| Direct-to-Restaurants | 2 | 1 | 1 | 12 | 28 | 272 | |
| Cooperative (wholesale) | 25 | 21 | 2 | 7 | 1 | 260 | |
| Non-Cooperative (wholesale) | 9 | 17 | 11 | 16 | 9 | 254 | |
| Internet | 0 | 0 | 0 | 1 | 2 | 313 | |
| CSA/Subscription | 1 | 2 | 3 | 1 | 1 | 308 | |
| Auctions | 4 | 8 | 2 | 13 | 3 | 286 | |
| Other | 3 | 1 | 2 | 3 | 4 | 303 | |
| * | 316 producers responding. | ||||||
Matt Ernst and Tim Woods, Department of Agricultural Economics
Grape production budgets with assumptions for American Hybrid (Table 3), European Hybrid/Vinifera (Table 2), and table grape varieties were developed during 2002 to estimate potential grape profitability in Kentucky (Table 1). Some general assumptions used in the construction of these budgets are indicated at the end of this report.
This analysis indicates that wine grapes will only be economically feasible in areas of the state where climate risk for grape production is minimized and wine grape market prices approaching $1,000 per ton are realized. Sound management that maximizes wine grape yields and minimizes input costs, as well as marketing that captures top grape prices, are absolutely necessary to make wine grape production economically viable in Kentucky.
Many current grape producers in Kentucky have established grape acreage using cost share funds formerly available through a state-level program. However, these budget estimates assume that the producer incurs 100% of the expense and risk for grape production. At an assumed price of $950/ton, American grape varieties do not appear to be an economically viable option in the long run if the producer incurs all establishment costs. Higher prices or cost savings must be obtained for long-term profitability using these varieties that are more suited to Kentucky climates (see Table 3).
According to these estimates, wine grape prices approaching or exceeding $1,000 per ton need to be obtained in order to economically break even in the long run (see Tables 2 and 3). Regional trends for wholesale grape prices indicate that this is at the peak of grape prices in Kentucky's region. New producers considering grape production should exercise care to engage in on-farm value-added activities to receive higher prices for grapes or acquire price contracts above levels that cover all costs of production.
Table grape production is an economically viable option in Kentucky; however, production requires a high level of management. Furthermore, the market for locally produced table grapes is very thin and is currently concentrated at the farmers' market and fine dining levels. Still, there may be some potential for table grape producers wishing to explore and expand markets in more populated parts of the state, especially in the Louisville and Northern Kentucky areas.
Grapes can be a successful alternative crop for Kentucky producers with a marketing strategy that maximizes price per ton. As for any new crop, however, producers should carefully examine their own costs and production situation before beginning production. Kentucky's climate and developing grape market can lend considerable risk for producers who do not pay utmost attention to marketing and management.
Future updates to these production budgets will reevaluate performance and projected yields of various winegrape varieties, as well as further verify labor time and costs involved in grape production.
Planting. Assumed plant cost varied according to the variety planted: $1.80/vine for American varieties, $4.00/vine for European hybrids, and $3.00/vine for table grape varieties. Trellis establishment was estimated based on estimated materials of 180 4-inch wooden posts, 20 6-inch wooden posts, 13,000 feet of wire, and miscellaneous trellis materials (end post anchors, wire strainers, etc.).
Production. University of Kentucky recommended cultural practices (fertilization, pesticides, cultivation, etc.) were followed in these budgets. Labor estimates were developed using data from current growers. These budgets estimate significantly more labor time than the Mid-Atlantic Grape Growers Guide for production. This is mostly due to the guide underestimating actual pruning time for grapevines in Kentucky production systems.
Equipment costs (irrigation and machinery) were estimated using 2002 university standards. A trickle irrigation system was assumed for the table grape budget only. A $15/month variable cost of irrigation was assigned for table grapes; this cost can vary greatly according to water source and irrigation system. Machinery costs were estimated using an Iowa State machinery cost generator customized for Kentucky.
Grape harvest lugs for wine grapes were assumed for purchase in first and full production years. Summary tables assume no cost of lugs in subsequent years. A daily electricity cost for cooling table grapes was assumed during the harvest season.
Labor: Labor costs were assigned at a wage rate of $9.00 per hour for untrained labor due to the care needed in many of the ordinary duties of grape production. Management, pesticide application, and other more specialized tasks were assigned a rate of $12.00 per hour. Due to the labor intensity required in grape production, lower wage rates could significantly raise profitability.
Fixed costs. Fixed machinery costs were also calculated using recommended cultural practices and the Iowa State machinery cost generator. A $220 annual cost for bird and wildlife pest control was assigned per acre of fruiting grapes. Table grape production included a $341 annual fixed cost for refrigeration. Annual fixed irrigation cost was assumed at $177.70 for table grapes.
Further budget assumption details may be obtained by contacting Matthew Ernst at mernst@uky.edu.
| Table 1. Estimated grape producer profitability summary: Kentucky, 2002. | |||||
| Variety | Estimated Establishment Cost1 | Estimated Annual Return to Land, Labor, & Management (full production) | Estimated Present Value of 10-Year Cumulative Return (9% discount rate) | Estimated Payback Period (land, labor & management) | |
| American Hybrid | $8,542 | $485 | -$1,702 | None (economically infeasible at $950/T) | |
| Vinifera (European Hybrids) | $9,696 | $1,761 | $183 | 10 Years ($1,150/T) | |
| Table Grape | $7,721 | $3,224 | $8,328 | 6 Years ($0.95/lb) | |
| 1 | Cash outlays until positive cash flows are generated. | ||||
| Table 2. Estimated vinifera wine grape annual return to land, labor, and management varying price/yield combinations: Kentucky, 2002. | ||||||||
| Yield (Tons) | Price per Ton | |||||||
| $950 | $1,000 | $1,050 | $1,100 | $1,150 | $1,200 | $1,250 | $1,300 | |
| 2.5 | -464 | -339 | -214 | -89 | 36 | 161 | 286 | 411 |
| 3.0 | 11 | 161 | 311 | 461 | 611 | 761 | 911 | 1,061 |
| 3.5 | 486 | 661 | 836 | 1,011 | 1,186 | 1,361 | 1,536 | 1,711 |
| 4.0 | 961 | 1,161 | 1,361 | 1,561 | 1,761 | 1,961 | 2,161 | 2,361 |
| 4.5 | 1,436 | 1,661 | 1,886 | 2,111 | 2,336 | 2,561 | 2,786 | 3,011 |
| 5.0 | 1,911 | 2,161 | 2,411 | 2,661 | 2,911 | 3,161 | 3,411 | 3,661 |
| Table 3. Estimated American hybrid wine grape annual return to land, labor, and management varying price/yield combinations: Kentucky, 2002. | ||||||||
| Yield (Tons) | Price per Ton | |||||||
| $750 | $800 | $850 | $900 | $950 | $1,000 | $1,050 | $1,100 | |
| 2.0 | -1,340 | -1,240 | -1,140 | -1,040 | -940 | -840 | -740 | -640 |
| 2.5 | -965 | -840 | -715 | -590 | -465 | -340 | -215 | -90 |
| 3.0 | -590 | -440 | -290 | -140 | 10 | 160 | 310 | 460 |
| 3.5 | -215 | -40 | 135 | 310 | 485 | 660 | 835 | 1,010 |
| 4.0 | 160 | 360 | 560 | 760 | 960 | 1,160 | 1,360 | 1,560 |
| 4.5 | 535 | 760 | 985 | 1,210 | 1,435 | 1,660 | 1,885 | 2,335 |
| Table 4. Estimated table grape return to land, labor, and management varying price/yield combinations: Kentucky, 2002. | |||||||||
| Yield (Pounds) | Average Price per Pound* | ||||||||
| $0.75 | $0.80 | $0.85 | $0.90 | $0.95 | $1.00 | $1.05 | $1.10 | ||
| 7000 | 874 | 1,224 | 1,574 | 1,924 | 2,274 | 2,624 | 2,974 | 3,324 | |
| 7500 | 1,249 | 1,624 | 1,999 | 2,374 | 2,749 | 3,124 | 3,499 | 3,874 | |
| 8000 | 1,624 | 2,024 | 2,424 | 2,824 | 3,224 | 3,624 | 4,024 | 4,424 | |
| 8500 | 1,999 | 2,424 | 2,849 | 3,274 | 3,699 | 4,124 | 4,549 | 4,974 | |
| 9000 | 2,374 | 2,824 | 3,274 | 3,724 | 4,174 | 4,624 | 5,074 | 5,524 | |
| 9500 | 2,749 | 3,224 | 3,699 | 4,174 | 4,649 | 5,124 | 5,599 | 6,074 | |
| * | Based on the following assumptions: ¾ yield at full price; ¼ yield at 80% of full price (e.g., $0.95 average price = 6,000 lb @ $1.00, 2,000 lb @ $0.80). | ||||||||