![]()
PR-483
Home | Introduction | Horticultural Crops | Marketing and Economics | Specialty Grains
SPECIALTY GRAINS—CORN
William Pearce, Ron W. Curd, and Chad Lee, Department of Agronomy
TC High Oil Blend® corn has both disadvantages and advantages in the cropping system. It costs more per bag, needs isolation from other corn, has uncertainty of pollination, and has the possibility of lower yields and test weights. TC Blend high-oil corn can have several advantages for the farmer. It has 80% more oil, 4 to 5% more energy, 6 to 8% more protein, 15% more lysine, and 11% more methionine than No. 2 yellow corn. All of this means an improved feed conversion for TC Blend high-oil corn versus No. 2 yellow corn.
Food grade white corn generally has a 10% yield loss as compared to No. 2 yellow corn. It usually will have a premium of from 25 to 50 cents per bushel above No. 2 yellow corn. However, the premium can be as high as $2.00 per bushel above No. 2 yellow corn.
Tests for TC high-oil corn were conducted at three locations in 2000, 2001, and 2002. There were 16 entries for 2000 and nine entries for both 2001 and 2002. The average yield data for 2000 are presented in tables 15A thru 15E in the 2000 Kentucky Hybrid Corn Performance Test (1). The chemical composition is presented in table 15F (1). The average yield data for 2001 are presented in tables 15A thru 15E, and the chemical composition is presented in table 15F in the 2001 Kentucky Hybrid Corn Performance Test (2). The average data for 2002 are presented in tables 16A thru 16E, and the chemical composition is presented in table 16F in the 2002 Kentucky Hybrid Corn Performance Test (3).
In the tables for each year, the annual mean yields presented are averages of the three replications of data at the test site. To decide if a yield difference between two hybrids is real, use the LSD (least significant difference) provided at the bottom of each table. In a yield column, a hybrid followed by an asterisk does not differ significantly (less than or equal to one LSD) from the highest yielding hybrid in that column. The coefficient of variation (C.V.) is a measurement of unexplained variation. The C.V. is expressed as a percentage of the mean.
Grain from a 20- to 25-plant hand-pollinated sample from each replication at the Lexington test for each year was analyzed by the Kentucky Grain Quality Lab at Lexington (4) using NIRS.
Only three hybrids (Pfister 3977-19, Pfister SK2550-19, and Wyffels W7355TC) were tested over all three growing seasons (2000-2002). There were no significant differences among those three hybrids when yield was averaged over all three years (Table 1). In tests conducted during the 2001 growing season at three locations (Robards, Fulton, and Lexington), Wyffels W7035(Bt) had the highest yield among high-oil hybrids tested at Robards and Lexington, while Pioneer Brand 34B25 had the highest yield at Fulton. However, there was no significant difference in yields at Robards and Lexington in 2001 among those top-yielding hybrids and Pfister 3977-19, Pfister SK2550-19, and Wyffels W7355TC. At Fulton in 2001, Pfister SK2550-19 and Wyffels W7355TC had yields that were not significantly different from Pioneer Brand 34B25.
The TC Blend high-oil yield and composition information will be useful to farmers feeding high-oil (high-energy) grain to livestock and to those participating in the high-oil, value-added grain market.
In 2002, the food grade white corn test (3) was conducted in a separate test at each Kentucky location, instead of being tested with the regular yellow corn hybrids. The data for each location are provided in tables 9W, 10W, 11W, 12W, 13W, 14W, and 15W of the 2002 Kentucky Hybrid Corn Performance Test (3). The annual, two-year, and three-year summaries are provided in tables 7W-1YR, 7W-2YR, and 7W-3YR, while the chemical composition data are provided in table 8W (3).
Of the white hybrids tested in 2002, Pioneer Brand 33T17(W) was among the highest yielding hybrids or had yields not significantly different from the highest yielding hybrids at six locations (Fulton, Princeton, Lewisport, Hopkinsville, Hodgenville, and Lexington). Zimmerman 1851W also produced consistently high yields among the hybrids tested at all the above locations except Lexington. Pioneer Brand 32T78(WH) had the highest yield at Hodgenville and was not significantly different from the highest yielding hybrids at Fulton, Princeton, Lexington, and Quicksand (Table 2).
The Corn Project at the University of Kentucky has collaborated with Dr. Larry L. Darrah on the National White Food Corn Test. The 2001 Late White Food Corn Performance Test (5) was planted at the Lexington and Henderson locations in Kentucky. Twenty-two white hybrids and two yellow checks were submitted by 10 commercial seed producers. Fourteen locations were planted in the overall agronomic evaluation.
The 2002 Late White Food Corn Performance Test (6) was planted at Lexington and Princeton. Twenty-one white hybrids and three yellow checks were used in the test. The data from the two Kentucky locations were not used in the overall averages due to extreme variability.
TC Blend high-oil corn can have a 10% yield loss compared with No. 2 yellow corn. TC Blend high-oil corn can be either fed to animals or sold on the open market. Because it is a higher energy source than No. 2 yellow corn, it can be used effectively for feed. Farmers often will contract with a company to sell TC Blend high-oil grain at harvest for a premium. The grain needs to be at least 6% oil or higher to get this premium.
Food grade white corn can receive a premium between 25 and 50 cents per bushel above No. 2 yellow corn. This premium can help offset the expected lower yields.
Research on TC Blend high-oil and food grade white corns can offer farmers an alternative to regular No. 2 yellow corn. The high-oil corn can offer a better energy source, especially for lactating animals. White corn research can offer farmers a possibility of better white corn to use in their farming operation, which can help them get a better premium for their product.
| Table 1. Three-year summary, 2000-2002, high oil hybrids, Lewisport and Fulton, Kentucky. | ||||||
| Brand/Hybrid | Yield bu/A 00-02 | % Moist 00-02 | % Stand 00-02 | Total % Lodged 00-02 | Test Wt. lb/bu 00-02 | |
| PFISTER 3977-19 | 180.2* | 14.3 | 85 | 5 | 54.5 | |
| PFISTER SK2550-19 | 175.7* | 12.6 | 83 | 5.5 | 56 | |
| WYFFELS W7355TC | 174.4* | 12.8 | 81.1 | 7.1 | 55.8 | |
| High Oil Average | 176.7 | 13.2 | 83 | 5.9 | 55.4 | |
| LSD (0.10) | 9.5 | 0.8 | 3.9 | 3.3 | 0.9 | |
| * | In any yield column, a hybrid mean followed by an asterisk does not differ significantly (less than or equal to one LSD) from the highest yielding hybrid in that column. | |||||
| Table 2. Annual summary, 2002, white hybrids (112-118 days to maturity) all locations. | ||||||
| Brand/Hybrid | Yield bu/A 2002 | % Moist 2002 | % Stand 2002 | Total % Lodged 2002 | Test Wt. lb/bu 2002 | |
| MEDIUM YELLOW CHECK | 163.1* | 15.5 | 98.6 | 0.6 | 56.5 | |
| PIONEER BRAND 33T17 (W) | 158.6* | 14 | 98.4 | 1.2 | 56.9 | |
| PIONEER BRAND 32T78 (WH) | 154.5 | 16.6 | 96.8 | 0.8 | 57.1 | |
| ZIMMERMAN 1851W | 150.9 | 19 | 97 | 1.1 | 54.5 | |
| ZIMMERMAN W7901 | 149.5 | 21.1 | 97.8 | 0.4 | 54.3 | |
| EXSEGEN ES210W | 148.7 | 16.1 | 97.7 | 1.3 | 56.4 | |
| ZIMMERMAN W7812 | 148.6 | 18.7 | 99.2 | 1 | 55.2 | |
| BECK’S 6918W | 146.6 | 18.4 | 98.1 | 0.8 | 56.6 | |
| PIONEER BRAND 32A85 (WH) | 140.8 | 15.1 | 99 | 1.3 | 56.9 | |
| Medium Average | 151.2 | 17.2 | 98.1 | 0.9 | 56.1 | |
| LSD (0.10) | 7 | 0.6 | 2 | 0.7 | 0.5 | |
| * | In any yield column, a hybrid mean followed by an asterisk does not differ significantly (less than or equal to one LSD) from the highest yielding hybrid in that column. | |||||
G.C. Brown, Department of Entomology
We measured the economic impact of insect pests on two quality-enhanced corns, high-oil and "waxy" corn. Both of these crops are cultivated using conventional corn production procedures but they bring a premium over traditional No. 2 yellow dent corn, and that premium is based on the oil or wax content. The objective of this research was to determine whether the insect pests affected the qualitative characteristics of the crop and, consequently, whether different management procedures should be used for insect pests of these crops.
Two insects were particularly studied, corn leaf aphids and European corn borer. The corn leaf aphid affects pollination, which was a particular concern for high-oil corn, while the corn borer disrupts many aspects of the crop's grain-producing capacity and is the most serious corn pest in Kentucky.
The research was conducted in a series of controlled field and greenhouse experiments during the 2000, 2001, and 2002 growing seasons in Central Kentucky and Princeton, Kentucky. The high-oil hybrid was Beck's 5405 while the waxy hybrid was Patriot's WX4060, both agronomically good choices for Kentucky.
The principal results were:
SPECIALTY GRAINS—SOYBEANS
Todd Pfeiffer, Department of Agronomy
The objective of this project is to produce soybean cultivars lacking the three seed lipoxygenase enzymes. These cultivars are being designed for use in three different soyfood roles: processed soyfoods, green immature edible soybean, and black mature edible soybean. These cultivars will be of maturity group IV, suitable for production in Kentucky.
The cultivar `7499', released by the Kentucky Agricultural Experiment Station, is a commodity soybean (yellow seed, yellow seed coat, and average seed size) released for yield potential and disease resistance. `7499' was crossed to the Japanese soybean parent, donating the three lipoxygenase null alleles, and then backcrossed two times. As such, about 88% of the genes should come from `7499'. After selfing, seeds were tested for the absence of the three lipoxygenase enzymes. In 2001, 34 second backcross lines were compared with the recurrent parent `7499' in yield tests at two locations. Five lines were selected for advanced yield testing in five locations in 2002. These five lines performed similarly to `7499' (Table 1). At harvest, 200 plants of each line were kept separate and tested for the absence of the three lipoxygenase enzymes. The triple-null plants of lines KY15-4 and KY10-126 will be grown in a seed increase in 2003 while the two lines are tested again in the novel soybean section of the Kentucky Soybean Performance Tests. The goal is to produce a commodity type soybean lacking seed lipoxygenases that will combine good yield and special characteristics for processed soyfoods.
Edamame is the Japanese term for soybean consumed immature as green vegetable soybean. Emerald is a large-seeded soybean cultivar with green seed cotyledons and green seed coats. It was released in 1975 by the University of Delaware as a specialty food cultivar and is adapted to production in Kentucky. Emerald was crossed with KY10-146, a triple lipoxygenase null line from the `7499' backcrossing program. Thirty-five first backcross plant families were tested for the presence of the three lipoxygenase enzymes. Seeds from 17 families were grown in 2002 and 2003. Selection and yield testing will begin in 2004. The goal is to produce a soybean line with large green seeds suitable for green vegetable soybean consumption. A similar program has been started using `Gardensoy 41', a soybean cultivar selected specifically for edamame production and released in 2000 by the University of Illinois.
Soybean with black seed coat and yellow seed cotyledons are often sold in home gardening catalogues for consumption as an edible mature black soybean. In cooperation with Kentucky Foundation Seeds, a black-seeded mutant of the cultivar `Stressland' was selected. This mutant performs as well as `Stressland' (Table 2). The black-seeded `Stressland' was crossed with KY10-126, and the population was advanced to the F4 generation, at which time black-seeded triple lipoxygenase null seeds were selected. Individual plants from these seeds are growing in 2003, and yield tests will begin in 2004.
| Table 1. Performance of five triple lipoxygenase null Kentucky breeding lines and their recurrent parent ‘7499' at five Kentucky locations in 2002. Tested in the novel soybean plots of the Kentucky Soybean Performance Tests. | |||
| Entry | Maturity Date | Height (in.) | Yield (bu/A) |
| 7499 | Oct. 12 | 28 | 36 |
| KY15-4 | Oct. 8 | 30 | 37 |
| KY11-59 | Oct. 3 | 28 | 34 |
| KY11-83 | Oct. 6 | 26 | 36 |
| KY10-126 | Oct. 9 | 30 | 35 |
| KY23-76 | Oct. 8 | 27 | 33 |
| Table 2. Performance of Black Stressland compared to Stressland in eight environments in 2001 and 2002. Tested in the novel soybean plots of the Kentucky Soybean Performance Tests. | ||
| Entry | Lodging (1 poor - 5 good) | Yield (bu/A) |
| Stressland | 2.6 | 44 |
| Black Stressland | 2.8 | 48 |
Eugene Lacefield, Department of Agronomy
The novel varieties being tested this year are just a few of the many that are emerging from both the public and private sectors. Some of these value-added soybean types will supply relatively small market niches, while others may be of a much broader market value. Novel soybeans generally yield less, so testing them will enable soybean producers to determine whether premiums for a given trait offset possible yield lag/drag. Examples are triple null soybeans, designed for edible soy products (this variety lacks three enzymes that produce off-flavors); natto soybeans, a small-seeded soybean used for food and export; and tofu, a big-seed/high-protein soybean also used for food and export. Other big-seed/high-protein types are used for animal food, which potentially has a large U.S. market.
Firms and institutions that possess novel soybean varieties are contacted and asked to supply seed for testing in Kentucky. Sufficient seed is requested of each emerging novel variety for planting two replicated plots at five locations. The novel soybeans are planted as part of the current soybean variety testing program. Management practices are those used for the standard soybean varieties and are conducted over a wide range of soil series and environmental conditions. Novel varieties are blocked by maturity group, as are the standard varieties, to allow for more timely harvest. After harvest, each novel variety is analyzed for protein and oil content by the Kentucky Corn Grain Laboratory using near-infrared (NIR) analysis. In each case, the 100 plus varieties in the Kentucky variety test will be run through the same quality characteristic screening, providing a basis of comparison of novel soybeans with current top-yielding varieties grown in Kentucky. This information will allow us to learn about both the actual levels and stability of a given novel quality characteristic under Kentucky conditions.
Twenty-eight novel soybean varieties are being tested at five locations across the state this year (2003). Twenty-two were tested in 2002, 19 in 2001, and 11 in 2000. The data (yield, lodging scores, maturity dates, and plant height) for the last three years can be found in the Kentucky Soybean Performance Tests published for each year. Novel soybeans are indicated by a "NS"prefix in all tables. Oil and protein data are provided (Table 2). A new Web page provides access to all Kentucky variety test publications at:
< http://www.uky.edu/Ag/GrainCrops/varietytesting.htm>.
Given that 2002 was the worst year so far for both yield and quality of novel soybean varieties, it may offer a "worst case" scenario for producers considering the incorporation of some acres of these soybeans into their overall cropping system. Just what level of per bushel premium might they need to have written into a production contract to give them a reasonable level of confidence of a break-even scenario in a worst case season (for novel soybeans) like 2002? Of course, that depends entirely on which varieties you choose to compare. If we match up Southern Cross Michael (48.0 bu/A) with KS4702sp (38.5 bu/A), that is a 9.5 bu/A difference. If the market price is, say $5.40/bu, a producer simply can multiply that price by the 48.0 bu/A for SC Michael, getting a per acre gross value of $259.20 for the "regular" soybean crop. To figure out how much of a per bushel premium would be needed to break even on the novel variety in this worst case year, the producer would divide the $259.20 SC Michael gross value by the KS4702sp per acre yield (38.5 bu/A); that would result in a $6.73/bu break-even price needed (or a $1.33 premium).
Of course, the above calculation assumes that production and marketing costs are the same for both "regular" and novel soybean varieties. But it does give a producer an idea of how to think, in very general terms, about how to compare relative value of these soybean cropping systems.
In general, the measured yields of the novel soybean varieties were lower than those of standard soybean varieties of corresponding maturity groups (Table 1) for all test years. The 2002 growing season was a year of extremes in Kentucky. The seventh wettest spring was followed by the eleventh hottest and sixteenth driest summer, followed by the wettest September/October in the past century. This represented the largest magnitude of rainfall variation by season within a single year. Novel soybean varieties were very sensitive to the 2002 weather extremes, and their yields and quality were depressed compared to 2000 and 2001 yields. Soybean producers need to have reliable data on grain yield, along with solid information on market value, before they take steps to adopt novel soybean varieties on their farms.
| Table 1. 2002 novel soybean variety test summary.A | ||||||||
| Brand—Variety | Yield (bu/A)b | Lodging | ||||||
| 2002 | 01-02 | 00-02 | 2002 | 01-02 | 00-02 | |||
| EARLY (GROUP III) | ||||||||
| ~ | GOLDEN HARVEST H-3945RR** | 51.1 | 1.6 | |||||
| ~ | DELTA KING 3968 RR* | 46.3 | 52.1 | 1.6 | 1.5 | |||
| ~ | NK BRAND S39-Q4 | 44.3 | 50.9 | 1.5 | 1.7 | |||
| ~ | DEKALB DKB38-52* | 43.5 | 50.1 | 1.8 | 1.7 | |||
| ~ | ASGROW AG3903* | 43.2 | 50.9 | 2.1 | 2.2 | |||
| ~ | CROPLAN GENETICS RC3838** | 42.9 | 49.9 | 1.8 | 1.8 | |||
| PIONEER VARIETY 93B87 | 42.6 | 51.3 | 2.2 | 2.1 | ||||
| ~ | GOLDEN HARVEST H-3983RR | 42.2 | 51.3 | 54.0 | 1.6 | 1.6 | 1.6 | |
| NS | U97-207427 (high protein, high yield) | 34.4 | 39.7 | 43.9 | 1.9 | 2.0 | 1.9 | |
| NS | U96-1612LS (large seed) | 30.5 | 2.0 | |||||
| NS | FG 1 (tofu type) | 29.8 | 39.2 | 43.4 | 2.2 | 2.3 | 2.0 | |
| NS | PIONEER VARIETY P9305 (tofu type) | 29.1 | 39.3 | 42.8 | 1.6 | 1.7 | 1.6 | |
| NS | U96-2831LS (large seed) | 28.6 | 2.5 | |||||
| NS | IA3016 (large seed & high protein) | 27.5 | 1.9 | |||||
| NS | IA3011 (large seed, high protein) | 26.4 | 35.6 | 39.6 | 2.1 | 1.7 | 1.7 | |
| NS | L96-5924 (natto type) | 26.4 | 2.4 | |||||
| NS | U98-310010 (small seed-lipoxygenase 2 null) | 25.4 | 2.1 | |||||
| NS | IA3006LF (lipoxygenase free, large seed & hp) | 25.1 | 1.5 | |||||
| NS | IA3015 (large seed) | 24.5 | 2.2 | |||||
| NS | FG 3 (tofu type) | 20.3 | 1.9 | |||||
| NS | IA2040LF (lipoxygenase free, large seed) | 14.8 | 1.6 | |||||
| GROUP III AVERAGE | 33.3 | 46.4 | 44.7 | 1.9 | 1.8 | 1.8 | ||
| LSD (0.10) | 2.8 | 2.2 | 2.3 | 0.2 | 0.2 | 0.2 | ||
| MID-SEASON (GROUP IV) | ||||||||
| ~ | SOUTHERN CROSS MICHAEL 4.2N, RR** | 48.0 | 1.8 | |||||
| ~ | DELTA KING 4763 RR* | 47.8 | 55.2 | 2.0 | 2.3 | |||
| ~ | VIGORO BRAND V42N3RR** | 47.7 | 1.6 | |||||
| ~ | VIGORO BRAND V47N3RR** | 47.5 | 1.8 | |||||
| ~ | STINE S4442-4** | 47.2 | 1.4 | |||||
| ~ | LG SEEDS C4112NRR** | 46.8 | 1.4 | |||||
| ~ | STINE S4202-4** | 46.6 | 53.3 | 1.4 | 1.7 | |||
| ~ | PIONEER VARIETY 94B74** | 46.2 | 2.2 | |||||
| ~ | CROPLAN GENETICS RC4222** | 45.8 | 1.6 | |||||
| ~ | ARMOR 47-G7** | 45.7 | 1.9 | |||||
| ~ | BECK 437NRR** | 45.6 | 1.8 | |||||
| ~ | DELTA KING 4868 RR | 43.8 | 51.0 | 53.0 | 1.8 | 2.2 | 1.9 | |
| ~ | ASGROW AG4403* | 41.7 | 49.7 | 51.5 | 1.9 | 2.1 | 1.9 | |
| ~ | ASGROW AG4902** | 41.4 | 48.4 | 51.0 | 2.0 | 2.2 | 2.0 | |
| CAVERNDALE CF 492 | 38.7 | 47.1 | 51.5 | 1.1 | 1.9 | 1.9 | ||
| NS | KS4702sp (large seeded variety) | 38.5 | 2.5 | |||||
| NS | KS4402sp (high protein variety) | 38.1 | 40.9 | 1.5 | 1.6 | |||
| NS | L96-5104 (natto type) | 34.9 | 37.6 | 42.7 | 1.9 | 2.3 | 2.1 | |
| NS | KS4302sp (small seeded food variety) | 30.9 | 29.4 | 2.1 | 2.9 | |||
| NS | IA4002 (small seed) | 28.7 | 2.9 | |||||
| GROUP IV AVERAGE | 42.6 | 45.8 | 49.9 | 1.8 | 2.1 | 2.0 | ||
| LSD (0.10) | 2.8 | 2.2 | 2.1 | 0.2 | 0.2 | 0.2 | ||
| LATE (GROUP V) | ||||||||
| UNISOUTH GENETICS USG 5601T | 42.3 | 2.3 | ||||||
| ~ | ARMOR 53-K3** | 42.1 | 1.7 | |||||
| P | DELSOY 5500** | 41.1 | 48.0 | 50.0 | 2.1 | 2.4 | 2.3 | |
| ~ | SOUTHERN STATES RT 540N** | 41.0 | 2.2 | |||||
| ~ | DELTA KING 5465 RR* | 41.0 | 47.1 | 50.2 | 2.2 | 2.5 | 2.2 | |
| ~ | NK BRAND S52-U3** | 40.9 | 48.7 | 2.7 | 3.0 | |||
| ~ | UNISOUTH GENETICS USG 510nRR** | 40.8 | 47.4 | 49.2 | 2.2 | 2.3 | 2.1 | |
| ~ | SOUTHERN CROSS JONATHAN 5.1N, RR** | 40.7 | 2.4 | |||||
| ~ | ASGROW AG5301* | 40.7 | 2.3 | |||||
| ~ | PIONEER VARIETY 95B32** | 40.5 | 46.5 | 49.9 | 2.1 | 2.4 | 2.1 | |
| ~ | DELTA KING 5366 RR | 40.1 | 44.5 | 3.1 | 3.3 | |||
| ~ | ASGROW AG5501* | 39.7 | 46.8 | 50.1 | 2.0 | 2.3 | 2.2 | |
| P | HUTCHESON | 37.9 | 45.6 | 49.9 | 2.1 | 2.8 | 2.5 | |
| NS | KS5202sp (high protein variety) | 37.2 | 46.4 | 1.8 | 2.4 | |||
| P | HOLLADAY | 36.7 | 46.9 | 50.2 | 2.1 | 2.9 | 2.7 | |
| NS | KS5001sp (small seeded food variety) | 31.6 | 1.5 | |||||
| NS | KS5201sp (small seeded variety) | 30.2 | 36.3 | 2.9 | 3.5 | |||
| GROUP V AVERAGE | 39.1 | 45.8 | 49.9 | 2.2 | 2.7 | 2.3 | ||
| LSD (0.10) | 2.5 | 2.2 | 2.2 | 0.3 | 0.2 | 0.2 | ||
| GRAND MEAN | 38.2 | 46.0 | 48.4 | 2.0 | 2.2 | 2.0 | ||
| ~ | Roundup Ready® variety. | |||||||
| P | Entries with a “P” prefix are public varieties. | |||||||
| NS | Entries with an “NS” prefix are novel soybean varieties that are emerging from both the public and private sectors. Some of these value-added soybean types will supply relatively small market niches, while others may be of much broader market value. Testing novel soybeans will enable producers to assess whether premiums for a given trait offset possible yield lag/drag. | |||||||
| * | Resistant to the soybean cyst nematode (Race 3). | |||||||
| ** | Resistant to the soybean cyst nematode (Race 3 and Race 14). | |||||||
| A | This table is a subset of “Table 4. Summary: Variety Test Tables 5-8" found in the 2002 Kentucky Soybean Performance Tests publication. The commercial varieties are those that are not significantly different (0.10 level) from the highest yielding cultivar. | |||||||
| B | Within a maturity group, shaded yields are not significantly different (0.10 level) from the highest yielding cultivar (bold data) of that maturity group and year column. | |||||||
| Table 2. 2002 Kentucky soybean performance test protein and oil composition.a | |||
| Variety/Brand | Protein % | Oil % | |
| NS | DAIRYLAND DST4203 (large-seed food type) | 35.0 | 18.0 |
| NS | FG 1 (tofu type) | 36.3 | 17.2 |
| NS | FG 3 (tofu type) | 40.2 | 15.8 |
| ~ | GOLDEN HARVEST H-3945RR** | 32.2 | 18.0 |
| P | HUTCHESON | 32.7 | 18.8 |
| NS | IA2040LF (lipoxygenase free, large seed) | 37.7 | 15.8 |
| NS | IA3006LF (lipoxygenase free, large seed & hp) | 38.2 | 15.2 |
| NS | IA3011 (large seed, high protein) | 39.5 | 16.5 |
| NS | IA3015 (large seed) | 38.2 | 16.4 |
| NS | IA3016 (large seed & high protein) | 38.3 | 16.1 |
| NS | IA4002 (small seed) | 36.0 | 15.8 |
| NS | KS4302sp (small seeded food variety) | 35.0 | 16.7 |
| NS | KS4402sp (high protein variety) | 38.2 | 16.1 |
| NS | KS4702sp (large seeded variety) | 34.9 | 17.4 |
| NS | KS5001sp (small seeded food variety) | 36.0 | 17.3 |
| NS | KS5201sp (small seeded variety) | 34.0 | 18.2 |
| NS | KS5202sp (high protein variety) | 36.4 | 19.9 |
| P | KS5502N** | 32.5 | 17.1 |
| NS | L96-5104 (natto type) | 36.9 | 16.4 |
| NS | L96-5924 (natto type) | 35.1 | 16.9 |
| NS | PIONEER VARIETY P9305 (tofu type) | 35.3 | 17.5 |
| ~ | SOUTHERN CROSS MICHAEL 4.2N, RR** | 32.2 | 18.5 |
| NS | U96-1612LS (large seed) | 37.2 | 16.3 |
| NS | U96-2831LS (large seed) | 38.6 | 17.4 |
| NS | U97-207427 (high protein, high yield) | 35.9 | 17.6 |
| NS | U98-310010 (small seed-lipoxygenase 2 null) | 32.7 | 15.8 |
| UNISOUTH GENETICS USG 5601T | 33.2 | 18.1 | |
| A | Variety protein and oil concentration were determined at the Union County location (all test locations for “NS” entries) and expressed on the basis of 13% moisture. The mean protein concentration was 33.5%, and the mean oil concentration was 17.9%. These data were provided by the Kentucky Corn Grain Laboratory using near-infrared (NIR) analysis. | ||
| ~ | Roundup Ready® variety. | ||
| * | Resistant to the soybean cyst nematode (Race 3). | ||
| ** | Resistant to the soybean cyst nematode (Race 3 and Race 14). | ||
| P | Entries with a “P” prefix are public varieties. | ||
| NS | Entries with a “NS” prefix are novel soybean varieties. | ||
C. Steele, T. Pfeiffer, D. Egli, L. Grabau, and S. Kumudini, Department of Agronomy
Soybean-based foods have become popular in North American markets, moving from health food groceries to supermarkets. This movement took on momentum in 1999 when the U.S. Food and Drug Administration decided to permit health claims to be placed on edible soybean products. Furthermore, the emerging markets in Asia have increased the demand for soybean-based foods (soyfoods). Soyfoods include tofu, miso, soy sauce, natto, tempeh, soymilk, soy flour, soy oil, concentrates and isolates, and soy sprouts. Although its first commercial uses were for oil, soybean has since become a valuable source of protein. The protein fraction of soybean seeds accounts for about 65% of the value of a bushel of soybeans, and this trend may well continue. With the loss of critical commodity markets in the south central regions, there is a need to explore lucrative alternative markets. Any new crop must be familiar to growers and should be such that they can be grown with farm equipment already owned. Production of high-protein, natto, and tofu soybean cultivars may provide growers an opportunity to investigate a new market.
Previously, we reported that in a two-year, two-location study of novel soybean cultivars, the novel cultivars tested obtained comparable yields to traditional cultivars or compensated for yield reduction with an increase in protein concentration. In the previous test, identical management strategies yielded similar results for the conventional and novel varieties, with a potentially higher price received for the novel varieties. Although growers may contract for a higher price for the novel varieties, there may be higher input costs for purchasing these specialty seeds. One way to lower the input cost would then be to reduce seeding rates, but this must not impact yield potential.
The objective of this study was to determine the optimum seeding rate for novel soybean cultivars.
Six maturity group III soybean cultivars, two high-protein, two tofu, and two natto soybean cultivars (Table 1) were planted at Spindletop and Princeton in 2002 and 2003. All experiments were planted as a randomized complete block with three replications. The treatments consisted of the six cultivars being tested and a range of seven seeding rates. The seeding rates were as follows: 2, 3, 4, 5 (standard), 6, 7, and 8 viable seeds per foot of row. Plot sizes were six 15-inch-wide rows 20 feet in length. The seeds were planted at Spindletop on May 17, 2002, and at Princeton on May 23, 2002. In 2003, the seeds were planted at Spindletop on June 2, 2003. Stand counts were made on the center two rows of each plot and converted to plants per acre.
Seeding rates did impact plant stand in 2002 and 2003. There was a linear increase in plant stand associated with a linear increase in seeding rate (Figure 1). According to AGR-130, Soybean Production in KentuckyPart III, the optimal plant stands for yield range from 139,000 to 167,000 plants/acre. In the current experiment, a range of plant stands were obtained that were below and above, as well as in the range of the optimal plant stand. Theoretically, yields would be expected to be lower under sub-optimal and supra-optimal plant stands and yields would peak at optimal plant stands. Dry conditions were blamed for the limited yield potential in 2002 (yield data only available for 2002 at this time). Irrigation at Spindletop in 2002 raised the yield at that location (Figure 2). In the current study, there was a low variability in mean yields due to the seeding rate treatments. That is, statistically, the seeding rate did not have a significant impact on yield (Figure 3). This may be interpreted as suggesting that reducing seeding rates may be a viable option for reducing input costs without impacting yield. However, we contend that under more optimal growing conditions, yield potential would be higher and plant density would have had a greater impact on yield, more representative of what is expected as outlined in AGR-130. It is our view that further tests under more favorable growing conditions than experienced in 2002 would be necessary to determine whether seeding rate of novel soybean varieties does or does not impact yield of these varieties. If indeed the seeding rate can be reduced without an impact on yield, this may help lower input costs of growing these specialty soybeans.
| Table 1. Name and seed characteristics of the varieties studied. | |
| Variety | Novel Characteristic |
| IA 3001 | High protein |
| IA 3011 | High protein |
| FG 1 | Tofu |
| FG 3 | Tofu |
| IA 2060 | Natto |
| IA 3013 | Natto |
D.B. Egli and W.P. Bruening, Department of Agronomy
The value of seeds harvested from grain crops comes from the oil, protein, and carbohydrates they contain. That value could be increased by manipulating seed composition to create a more desirable and useful product. Plant breeders have changed seed composition in many crops using traditional breeding methods, but new techniques from molecular biology should make manipulation easier and increase the magnitude and type of changes possible.
Manipulation of seed composition frequently causes changes in other components of the seed and in yield. For example, increasing seed protein concentration often results in reductions in oil concentrations and yield (4). Such compensatory changes hamper the production of cultivars with high seed protein concentrations and commercially acceptable yield. These offsetting changes are usually explained on an energy basis because synthesis of protein or oil requires more energy and assimilate per unit weight of product than carbohydrates (protein: 2.50; oil: 3.03 and carbohydrate: 1.20 gm of assimilate/gm product) (3). If the supply of assimilate from photosynthesis remains the same, increasing protein concentration must cause other changes to maintain the same total energy content of the yield.
Seed fill duration (SFD), an important component of yield, has been linked to the ability of the plant to supply N to the developing seed (3). Although this linkage has been questioned (2), it is possible that the higher total seed N requirement (seed N concentration x total rate of dry matter accumulation) of high protein genotypes could accelerate the loss of N from the vegetative plant, increasing the rate of leaf senescence, shortening the seed-fill period, and decreasing yield. Conversely, if the total N requirement per plant stays the same in high protein genotypes (i.e., yield is lower), or if the rate of senescence is independent of the N requirement (2), changing the seed protein level would have no effect on SFD. The effect of changing seed N concentration on yield depends in part on which of these possible mechanisms is most important.
The physiological processes responsible for the negative relationship between soybean yield and seed protein concentrations are not well understood. The growth and development of the individual seed is a key component of the yield production process (1). Understanding the effects of changing seed protein concentration on the growth of the individual seed will lead to a better understanding of the interactions between seed protein concentrations and yield.
We compared three soybean genotypes with high seed protein concentrations with three genotypes with normal levels of seed protein in a field experiment in 2002 to see if seed protein concentration has any effect on the rate or duration of seed growth. The rate of seed growth was similar among high and low protein genotypes (Table 1); however, the rate of N accumulation was higher for the high protein genotypes. There was no significant difference among genotypes in the length of the seed filling period. These preliminary data suggest that the primary components of seed growthseed growth rate and seed filling periodwere not affected by variation in seed protein concentration. These results must be verified with at least two more years of data before we can draw any conclusions about the effects of seed protein concentration on the physiological processes that control yield.
| Table 1. Seed growth characteristics of soybean genotypes with high and low seed protein concentrations, 2002. | ||||||
| Variety | Seed Growth Rate | Seed Fill Duration* | Yield | Seed Size | ||
| Dry Matter | N | |||||
| mg seed-1 dry-1 | mg N seed-1 dry-1 | days | gm-2 | mg seed-1 | ||
| High protein | ||||||
| NE3396 | 4.6 | 0.29 | 30 | 386 | 166 | |
| KS4402 | 4.0 | 0.25 | 41 | 369 | 173 | |
| K1431 | 5.9 | 0.43 | 29 | 311 | 162 | |
| Mean | 4.8 | 0.32 | 33 | 355 | 167 | |
| Normal protein | ||||||
| Pennyrile | 5.4 | 0.31 | 30 | 281 | 168 | |
| Flyer | 4.3 | 0.27 | 31 | 379 | 144 | |
| Hutcheson | 4.4 | 0.26 | 37 | 295 | 169 | |
| Mean | 4.7 | 0.28 | 33 | 318 | 160 | |
| CV 1% | 8 | 12 | 7 | 7 | 5 | |
| LSD (0.05) | 0.74 | 0.069 | 4.2 | 45 | 16 | |
| * | Effective filling period = (final weight/seed)/seed growth rate. | |||||
SPECIALTY GRAINS—WHEAT
C.A. Knott and D. Van Sanford, Department of Agronomy
Wheat cultivars are placed into two color classes, red and white, based upon the seed coat color. White wheat has several advantages over red wheat, such as a higher flour extraction rate, greater aesthetic appeal of whole wheat products, and a more valuable bran (3). Seed color is controlled by three genes; red genes are dominant to white genes. Wheat breeding programs that choose to develop white wheat lines must identify and utilize effective methods for differentiating between red- and white-seeded wheat.
The main disadvantage of white wheat is its susceptibility to preharvest sprouting. Preharvest sprouting occurs when the seed germinates in the wheat spike before it is harvested from the field. Preharvest sprouting generally occurs when there is frequent precipitation at harvest time (4) and renders the seed undesirable due to increased enzyme activity, sugars and total protein, changes in amino acid composition, and decreases of starch (2). Therefore, the major issues to address when developing white wheat are differentiation of red and white seed and establishing tolerance to preharvest sprouting.
Six white-seeded wheat lines and five red-seeded cultivars were evaluated using a modified NaOH method (1) (Table 1). Thirty-five seeds of each line were placed into 100 x 15 mm petri dishes. Five percent NaOH solution was poured over the seed, and the seed were allowed to soak in the solution for five minutes. After five minutes, the seeds were rinsed with water and placed into plastic bags. The seeds remained at room temperature for 24 hours and then were placed into a 4°C cold room. Germination was recorded each day from days one to seven.
Thirty physiologically mature spikes were collected from 20 experimental lines, dried for three days at 29.4°C, and then placed in a freezer for preservation until evaluation can occur. The spikes are placed into a mist chamber for four days in a greenhouse. They are allowed to dry and then rated for preharvest sprouting.
The modified NaOH method for evaluating seed color was very effective. The data were analyzed to determine differences between the red and white seed classes and also by line. When treated with NaOH, the germination rate of white seeds was significantly higher than that of red seeds (Tables 2 and 3). However, when analyzed by line, 25W33, Cardinal, and 25W60 germinated at a significantly higher rate, and GA 871339W and VA 96W-403WS germinated at a significantly lower rate than the rest of the lines (Tables 4 and 5). Cardinal's significantly higher germination rate could be explained by its susceptibility to preharvest sprouting. Therefore, GA 871339W and VA 96W-403WS may possess more resistance to preharvest sprouting than the other white lines. This hypothesis will be tested using the preharvest sprouting protocol explained above. The most striking results of the experiment were that the white seed changed color very rapidly when treated with NaOH, allowing for a simple method of visual inspection and preservation of seed viability.
The samples for the preharvest sprouting evaluation have been collected and frozen; however, evaluation will not occur until fall 2003.
| Table 1. Cultivars evaluated using a modified NaOH method. | ||
| Line | Seed Color | Source |
| 25W33 | White | Pioneer Hi-Bred International |
| GA 871339W | White | University of Georgia |
| VA 96W-403WS | White | Virginia Tech |
| VA 97W-375WS | White | Virginia Tech |
| VA 98W-170WS | White | Virginia Tech |
| 25W60 | White | Pioneer Hi-Bred International |
| Cardinal | Red | Ohio State University |
| Allegiance | Red | University of Kentucky |
| 25R37 | Red | Pioneer Hi-Bred International |
| Foster | Red | University of Kentucky |
| Roane | Red | Virginia Tech |
| Table 2. Analysis of variance for the germination rate of the two color classes when treated with NaOH. | ||
| Source | df | P-value |
| Color | 1 | 0.0013 |
| Error | 414 | |
| Table 3. Mean germination rate of the red and white wheat seed when treated with NaOH. | ||
| Class | Mean | |
| White | 0.3975 a | |
| Red | 0.31957 b | |
| * | Means followed by different letters are significantly different at P < 0.05. | |
| Table 4. Analysis of variance for the germination rate of the lines when treated with NaOH. | ||
| Source | df | P-value |
| Line | 10 | <.0001 |
| Error | 1040 | |
| Table 5. Means for the germination rate of the lines when treated with NaOH. | ||
| Line | Mean | |
| 25W33 | 0.8425 a | |
| Cardinal | 0.7782 ab | |
| 25W60 | 0.7431 b | |
| VA 97W-375WS | 0.7153 bc | |
| VA 98W-170WS | 0.6615 cd | |
| Roane | 0.6336 d | |
| Foster | 0.6227 d | |
| 25R37 | 0.5955 d | |
| Allegiance | 0.4987 e | |
| GA 871339W | 0.3597 f | |
| VA 96W-403WS | 0.1664 g | |
| * | Means followed by different letters are significantly different at P < 0.05. | |
John H. Grove and Antonio A. Marchi, Department of Agronomy
Soft red winter wheat is an important component of row crop rotations in Kentucky. Markets, especially export markets, for soft red winter wheat appear to be limited. Soft white wheat is taking some of those markets. High protein is desired in certain end uses (crackers) for soft white wheat. Nitrogen management is the key to the successful management of grain protein levels in soft wheat. While it is well known that late-season (after Feekes 8) application of fertilizer nitrogen (N) to wheat will tend to raise grain N (protein) concentrations, an effective system of predicting the need for such a late fertilizer N application does not exist for Kentucky's wheat producers. Our hypothesis is that the need for late fertilizer N applications is related to soil nitrogen levels, tillage-induced mineralization of N from organic matter, and that this release of soil N can be managed by monitoring the crop's seasonal N status, utilizing either the chlorophyll meter or tissue N analysis. With such information, Kentucky producers would be in position to better serve high protein soft wheat markets.
The research has been conducted for two winter wheat production seasons (2000-01 and 2001-02), and a third (2002-2003) is under way. There have been two components to the work, both performed in small plot experiments. The first component addressed Objectives 1 and 2, above, and was established at locations alongside small grain variety trial sites in Western Kentucky to determine soil-environment, cultivar, and basic N rate management aspects of the response. The second component focused on Objective 3 and consisted of a single experiment established at Spindletop (in Lexington) to determine previous crop and late N timing aspects of the response.
The field study located at the Western Kentucky sites consisted of two cultivars (two soft white), three levels of early N (75, 105, and 135 lb N/A; 33% at Feekes 2-3 and 67% at Feekes 5) as urea, and three rates of late N (0, 20, and 40 lb N/A at Feekes 10), also as urea. Top-yielding cultivars were selected using information from University of Kentucky variety trials. Urea was used because it is widely available and is often the cheapest source of N for topdressing wheat in the spring. Four replications (blocks) were used in each experiment. As genetics was of lesser importance, wheat cultivar was the main plot, while a complete factorial in the N management treatments was randomly assigned to split plots within each of the main plots.
The second component experiment involved an existing crop rotation trial, where no-tillage wheat is grown after both full season soybean and corn, which was the main plot. Wheat cultivars (one soft red and one soft white) served as split plots. The split-split plot treatments consisted of a factorial combination of three rates of late-season N (0, 20, and 40 lb N/A as urea) at four times of application (Feekes 9, Feekes 10, Feekes 10.2, and seven days after Feekes 10.2). Basal N management consisted of 75 lb N/A. Four replications (blocks) already existed in the crop rotation trial.
In general, there was little difference in grain yield between the two cultivars (Table 1). Yield responded positively to the early N rate at two sites, but the increment in yield was generally small, about 5 to 6 bu/A (Table 1). Late N rate also tended to raise yields, but the response was statistically significant only once (Table 1). In general, N nutrition was sufficient for near maximum yields in these studies.
The 25W33 always exhibited less grain protein than the 25W60, although chlorophyll meter (SPAD) readings taken on flag leaves at Feekes 10 were usually higher (Table 2). Cultivar differences like this have been observed previously. Greater early N resulted in increased grain protein at several locations but was not dramatically improved at all sites (Table 2). The chlorophyll meter readings were more responsive to early N than was grain protein (Table 2). Late N rates resulted in much more dramatic increases in grain protein (Table 2), and those increases tended to be larger when the chlorophyll meter reading was lower. At this point, the results support the hypothesis that the chlorophyll meter can be used to guide late, near-flowering fertilizer N applications intended to raise grain protein in these soft white cultivars.
In both years, wheat after corn exhibited erratic tillering and stand development and was not used in the protein study. In 2001, but not 2002, there was an interaction between cultivar and previous crop (Table 3). There was little difference between the two varieties when grown after soybean in either year, but in 2001 Pioneer 2540 yield declined more (-22 bu/A) when planted after corn than did Pioneer 25W33 (-13 bu/A).
The first of the late N applications to wheat after soybean was made between flag leaf emergence and "boot" growth stages (Feekes 9.5). The second was made during flowering (Feekes 10.2), while the third and fourth were made one and two weeks after flowering. All late N was broadcast over the top of the crop. Late fertilizer N addition positively influenced yield (Table 2), but there was no difference due to cultivar or the date that the late N application was made. Grain protein was positively related to late N application rate and was generally greater for the soft red wheat (Pioneer 2540) but was not affected by late N application date (Table 2).
There were significant interactions between cultivar and both late N application date and rate on grain protein concentration (data not shown). Pioneer 2540 was more sensitive to the other treatment factors than Pioneer 25W33. First, grain protein concentrations in P2540 rose over the first three application dates, while that for P25W33 did not (data not shown). Second, as the rate of late N was increased, the grain protein concentration in P2540 increased more (+2.1%) than did that for P25W33 (+1.5%). It is not clear why P2540's grain protein concentrations were more sensitive to the timing of the late N. We observed that leaf chlorophyll levels (measured with a chlorophyll meter) were generally higher in P2540 and were raised more by 40 lb N/A late N rate (data not shown). The P25W33 may not have been as able to recover the late N from the soil, or, more likely, its demand for grain protein N was being met by retranslocation from vegetative tissues. It is clear from this research that the grower's choice of cultivar can play a large role in the response to late N management. The research will be repeated in the 2002-2003 wheat production season.
The first of the late N applications to wheat after soybean was made between flag leaf emergence and "boot" growth stages (Feekes 9.5). The second was made during flowering (Feekes 10.2), while the third and fourth were made one and two weeks after flowering. All late N was broadcast over the top of the crop. Late fertilizer N rate positively influenced yield (Table 4) in 2001 but not 2002. This was somewhat surprising because it has generally been believed that such late N nutritional supplements have no yield benefit. The timing of the late N application had no impact on yield in either year (Table 4). Grain protein was not influenced by the timing of the delayed N application in either year but responded positively to the rate of the late N both years (Table 4). There was no interaction between late N fertilizer rate and cultivar or the date that the late N application was made.
The results demonstrate that the late (at-flowering) application of urea can substantially increase the grain protein level of the soft winter wheats grown in Kentucky. The degree of protein response was negatively influenced by the N nutritional status of the crop at flowering but only modestly. The chlorophyll meter provided additional predictive information regarding the degree of response to be expected. The research demonstrates that there is considerable potential for Kentucky's soft wheat producers to meet future protein specifications.
| Table 1. Main effects of early- and late-season N nutrition on yield of two soft white winter wheats. | |||||||
| Cultivar | Early Fertilizer N Rate | Late Fertilizer N Rate | Grain Yield | ||||
| 2001 McLean | 2001 Warren | 2002 Caldwell | 2002 Warren | ||||
| lb N/A | lb N/A | bu/A | |||||
| P25W33 | 94.7a | 93.6a | 97a | 97a | |||
| P25W60 | 95.4a | 84.1b | 96a | 99a | |||
| 75 | 92.5b | 88.8a | 94a | 95b | |||
| 105 | 95.2ab | 89.2a | 97a | 99ab | |||
| 135 | 97.5a | 88.5a | 99a | 101a | |||
| 0 | 94.1a | 89.4a | 95a | 96b | |||
| 20 | 95.2a | 87.7a | 98a | 100a | |||
| 40 | 95.9a | 89.5a | 98a | 99ab | |||
| * | Values within a column followed by the same letter are not significantly different at the 90% level of confidence. | ||||||
| Table 2. Main effects of early- and late-season N nutrition on protein and SPAD readings in two soft white winter wheats. | |||||||||||||
| Cultivar | Early Fertilizer N Rate lb N/A | Late Fertilizer N Rate lb N/A | 2001 McLean | 2001 Warren | 2002 Caldwell | 2002 Warren | |||||||
| Grain Protein % | SPAD Reading | Grain Protein % | SPAD Reading | Grain Protein % | SPAD Reading | Grain Protein % | SPAD Reading | ||||||
| P25W33 | 12.0b | 41.7a | 13.5b | 49.5b | 11.1b | 41.3a | 10.7b | 41.2a | |||||
| P25W60 | 12.9a | 40.9a | 14.4a | 51.7a | 11.8a | 40.0b | 11.5a | 40.9a | |||||
| 75 | 12.1c | 39.9c | 13.9a | 49.7b | 11.4a | 40.0b | 10.7b | 40.4b | |||||
| 105 | 12.4b | 41.3b | 14.0a | 51.0a | 11.3a | 40.4ab | 11.2a | 40.7b | |||||
| 135 | 12.8a | 42.7a | 14.0a | 51.2a | 11.3a | 41.5a | 11.3a | 41.9a | |||||
| 0 | 11.1c | 13.4c | 10.8c | 10.4c | |||||||||
| 20 | 12.5b | 14.0b | 11.4b | 11.0b | |||||||||
| 40 | 13.7a | 14.5a | 12.1a | 11.8a | |||||||||
| Table 3. Effect of previous crop and cultivar on yield of no-tillage wheat. | ||||||
| Previous Crop | 2001 | 2002 | ||||
| Wheat Cultivar | Grain Yield | Wheat Cultivar | Grain Yield | |||
| bu/A | bu/A | |||||
| corn | P25R40 | 63.5c | P25R37 | 48.0b | ||
| P25W33 | 74.4b | P25W33 | 45.7b | |||
| soybean | P25R40 | 85.3a | P25R37 | 62.3a | ||
| P25W33 | 87.3a | P25W33 | 67.2a | |||
| * | Values within a column followed by the same letter are not significantly different at the 90% level of confidence. | |||||
| Table 4. Main effects of the rate and timing of late fertilizer N on yield and protein for no-till wheat following full-season soybean. | ||||||||
| 2001 Late N Date | 2001 Late N Rate lb N/A | 2001 Grain Yield bu/A | 2001 Grain Protein % | 2002 Late N Date | 2002 Late N Rate lb N/A | 2002 Grain Yield bu/A | 2002 Grain Protein | |
| 1-May | 90.8a | 12.7a | 26-Apr | 64.8ab | 13.2a | |||
| 10-May | 91.1a | 12.8a | 3-May | 61.9b | 13.5a | |||
| 16-May | 89.5a | 12.7a | 10-May | 66.6a | 13.6a | |||
| 23-May | 88.2a | 12.5a | 22-May | 64.9ab | 13.5a | |||
| 0 | 86.3b | 11.7c | 0 | 64.7a | 12.0c | |||
| 20 | 90.7ab | 12.7b | 20 | 66.2a | 13.8b | |||
| 40 | 92.7a | 13.5a | 40 | 62.7a | 14.5a | |||
| * | Values within a column followed by the same letter are not significantly different at the 90% level of confidence. | |||||||
SPECIALTY GRAINS—DRYING, STORAGE, AND GERMINATION
Samuel G. McNeill, Michael D. Montross, Dennis M. TeKrony, I. Joseph Ross, Departments of Biosystems and Agricultural Engineering and Agronomy
Many stakeholders in the grain trade have suggested a market shift from the historical/traditional "grade"-based system to a new "traits"-based system. The grade-based system measures physical properties of a product to set the price, whereas both physical and intrinsic properties of a product are used to set the price with the traits-based system. This change reflects the fact that grain buyers recognize the value of components in grain products (such as starch and oil in corn, protein in wheat, and oil and protein in soybeans) and know that price premiums paid to farmers can be recovered by adding value to the product for downstream processes such as baking, distilling, starch extraction, or ethanol production.
Specialty grains have received much attention by Kentucky farmers recently because they are frequently sold at premiums of 5 to 50 cents per bushel above prices offered for traditionally grown No. 2 yellow corn or No.1 soybeans. For example, farmers have been offered a 20-cent per bushel premium for high-oil corn with a minimum oil content of 6.5% and an additional cent for each 0.1 % point of oil above the base level up to 8.0% (or a maximum premium of 35 cents per bushel). Of course, farmers always consider the yield potential and any additional handling, drying, or storage costs of new crop hybrids before they can fully evaluate an economic comparison between new crops and historically grown grains.
Drying and storage characteristics and seed deterioration rates of many specialty grains are virtually unknown and may be substantially different from the varieties that are historically grown. A related drying study at Purdue University has shown differences up to 15% in the drying time between two high-oil corn varieties (3), and although they observed stress cracks for both products, no attempt was made to determine either equilibrium moisture content levels or seed deterioration rates for high-oil corn.
Accurate equilibrium moisture content (EMC) and equilibrium relative humidity (ERH) data are essential for the design and operation of energy-efficient drying and storage processes. Little data exist for specialty grains, and data that are available for historical crops may be substantially different. Moreover, a hysteresis phenomenon has often been found to exist in some grain lots (i.e., a difference in EMC values between drying and wetting processes). The primary motivation of this work involves desorption, which is important in conditioning and storage applications.
This study was conducted to determine optimum drying and storage conditions for specialty grains to help farmers, elevator operators, and grain storage/seed warehouse managers protect the seed quality and high-value traits of these products. New recommendations may be needed to properly dry and store specialty grains that have different chemical composition from commonly grown varieties.
A known variety each of high-oil corn (Pfister and Wyffels commercially available varieties), triple-null soybeans (experimental varieties IA 2025 and IA 2042), soft white winter wheat (commercially available Pioneer 25W60), and a popular corn (Pioneer) and soft red winter wheat (Pioneer 2552) were selected for this study. Each seed lot (~ 30 kg/60 lb each) was collected and shelled/thrashed by hand or with a plot combine at traditional harvest moisture content levels during 2001 and 2002. Target moisture levels for corn and wheat were 20% wet basis (wb), while soybeans were harvested at 15%. Grain moisture levels were determined after harvest and throughout the drying and moisture conditioning tests by a Dickey-John GAC II bench top moisture meter.
All samples were cleaned with either round metal screens or with a stationary bench top grain cleaner following threshing. After shelling/threshing and cleaning, samples were held in sealed plastic bags in refrigerated storage (5°C/41°F) until testing. All EMC and drying tests were conducted in the University of Kentucky Grain Quality Laboratory in Lexington (Biosystems and Agricultural Engineering Department).
A dynamic measuring system was selected to determine EMC relationships of new/specialty crops and conventional grains. With this system, a continuous air supply with constant temperature and relative humidity is circulated through a relatively small grain/material sample. Air conditions were monitored continuously and sample weights were measured periodically until a constant weight was observed, at which point the final/equilibrium moisture content of the grain sample was determined.
Three temperature levels (10, 25, and 40°C) and five relative humidity levels (40, 50, 60, 70, and 80%) were used for the EMC experiments. Four replications at each temperature and relative humidity condition were chosen for each grain type (480 total tests with eight grain samples). Observed values were compared to traditional values predicted by the American Society of Agricultural Engineers (ASAE) standards for similar grains (1), specifically the modified-Henderson and Chung-Pfost equations for corn and wheat and the modified-Halsey equation for soybeans.
During drying tests, the moisture loss from each sample was measured under constant temperature, relative humidity, and airflow conditions near typical mean dew point temperatures. The following list describes the range of experimental conditions that were selected (six replications of each grain sample and test condition for a total of 144 tests):
Seed germination and vigor tests will be conducted following the drying tests with selected specialty grains under similar seed moisture conditions (10, 13, and 16% db moisture) and temperature range (20, 35, and 50°C) as previously described by Tang, et al. (4).
An appropriate equation will be selected to describe the drying and seed deterioration rates for each grain. Equation parameters will be tested statistically with chemical components of each grain to determine whether a significant correlation can be identified. Results of the drying, storage, and germination studies will be summarized in written reports and presented at professional meetings.
The equilibrium moisture content experiments have been completed, although they took longer to finish than originally anticipated. This caused a delay in starting the drying tests and subsequently the germination tests, although they are progressing rapidly and expected to be completed soon. For this reason, results of all EMC experiments and the high temperature dryer simulation tests are given in this report.
Observed equilibrium moisture content values for the two high-oil corn samples (Pfister and Wyffels) and conventional yellow corn variety (Pioneer) that were tested are shown in Figure 1 a, b, and c for temperatures 10, 25, and 40°C, respectively. An expected variance between values of approximately one point of moisture was anticipated and was observed for the most part among both the new crops, traditional variety, and predicted (ASAE) value. Exceptions were noted at high humidities (> 70%) for low (10°C) and moderate (25°C) temperatures. Little hysteresis was observed between the drying phase and rewetting phase except for the highest temperature and humidity (40°C and 80%).
Observed EMC values for the two specialty soybean varieties are compared with traditional (ASAE) values in Figure 2 a, b, and c for temperatures 10, 25, and 40°C, respectively. Close agreement was noted for all values at 40°C with a noticeable hysteresis effect at 80% relative humidity, as with corn. There was good agreement between both new varieties for all conditions. A noticeable departure between traditional/expected EMC and observed values for new crop soybeans was apparent at the low and moderate temperatures for all humidity levels except 70 and 60, respectively, and merits further investigation.
Observed EMC values for SRW wheat (for 2001 and 2002), SWW wheat and traditional/expected (ASAE) values are shown in Figures 3 a, b, and c for temperatures 10, 25, and 40°C, respectively. As with corn and soybeans, good agreement was noted (< 1% point difference) between new crop and traditional wheat varieties for most conditions, with one exception being between SRW 01 and SWW 01 at 40°C. Unlike corn and soybean tests, there was poor agreement between the observed and expected (ASAE) values for nearly all conditions, except for SRW 01 at 40°C with humidity levels < 60 %. Hysteresis was observed for most conditions for all wheat varieties used in this study, except for 70% at 10°C and 60% at 25°C.
Results of the high temperature dryer simulation test for the two high-oil corn varieties are shown in Figure 4 a and b (Wyffels and Pfister, respectively), along with predicted values that were found through non-linear regression with a well-established equation for predicting the rate of conditioning (2). Little difference is noted between their drying times from an initial moisture level of 17.4 and 17.3%, respectively. Fortunately, the modified Page equation described the drying process of both new crops extremely well.
Observed results of the high temperature drying simulation for new crop soybeans are shown in Figure 5 a and b along with the predicted values generated by the modified Page equation. IA 2042 was found to dry more slowly even though the initial moisture content was nearly equal to that of IA 2025 (< 0.5% of moisture). It will be interesting to see if this difference holds true in the other drying tests. The modified Page equation simulated the drying behavior of both varieties extremely well.
Results of the high temperature drying simulation for new and traditional wheat varieties are shown in Figure 6 a and b with an initial moisture level above 20%. Both varieties dried to the market level (13.5% wb) in less than 30 minutes and to near 8% in three hours; thus, a similar drying rate was observed. The modified Page equation simulated the drying behavior of both varieties extremely well.
One goal of this study was to determine whether differences exist between drying and storing properties of specialty grains compared to commonly grown varieties. Initial results of the EMC/storage data are somewhat mixed in that there is good agreement (< 1% moisture point) between observed and predicted values for most environmental conditions but as much as a 3% difference for a few extreme conditions. Generally, there was good agreement between EMC values for new varieties in all three crops.
Results of the high temperature dryer simulations (80°C and 6% RH) are reported for each new crop tested. Little difference was found in the drying rate between the two high-oil corn lots or between the soft red winter wheat and soft white winter wheat varieties tested. One new soybean variety (IA 2025) dried at a faster rate than the other variety (IA 2042). The modified Page equation performed extremely well in predicting the observed drying rate for each grain lot tested and is recommended as an algorithm for programmed logic controllers in high temperature dryers.
The second set of drying tests (high temperature bin drying simulation), low temperature bin drying simulations, and germination tests of all test material were not complete at the time this report was written.
SPECIALTY GRAINS—ECONOMICS
Gregg Ibendahl, Department of Agricultural Economics
We have made good progress toward determining how Kentucky growers can benefit from specialty grains. Two students have been partially funded from this grant to work on specialty grain-related theses. The first student funded, Daniel Green, wrote a two-article thesis titled "A Farm-Level Analysis of Specialty Crop Production in Kentucky." The abstract of the thesis follows.
Special purpose crops are those with traits designed to meet the specific demands of an end user. A mean-variance (E-V) mathematical programming model and sensitivity analysis are used to quantify and discuss the potential net returns and risk associated with the adoption of special purpose crops at the farm level. Furthermore, a spreadsheet-based decision aid is developed to assist farmers in the decision of whether or not to produce high-oil corn on their operation.
Results from this study indicate that the profitability of high-oil corn is very marginal, dependent upon the ability of the crop to yield as well as conventional corn and gain significant premiums. The potential of marketing this crop through a producer-owned cooperative seems promising.
This thesis project resulted in refinement of a specialty grain analysis tool that is available from the University of Kentucky's Department of Agricultural Economics. This spreadsheet-based tool can be used to evaluate high-oil corn and to compare marketing via a cooperative with contract production. The spreadsheet tool incorporates risk preferences of an individual producer into the analysis.
A second student, Jennifer Rogers, wrote a thesis comparing the profits and risk of using Bt corn against conventional corn and conventional corn with a crop warranty. The next two paragraphs are from her thesis and summarize the study.
Corn producers, like all producers, face production risks. In particular, corn producers face risks related to weather, price, pests, etc. This study focuses on the risk associated with a specific pest, the Southwestern Corn Borer (SWCB). In Kentucky, the SWCB has been described as the most devastating pest to corn. To combat this risk, several options have been developed. A new technology in the form of Bt corn has made its way into production to protect producers from the damages caused by the SWCB. Producers also have the option of purchasing crop insurance to protect themselves from yield losses. This study has sought to compare the risk associated with different production strategies: Bt corn, conventional corn, and insured conventional corn, to develop a framework for producers to choose their best option.
The certainty equivalents provide risk-adjusted revenue levels for a given producer. A common conclusion for all planting dates is that a highly risk-averse producer should prefer to produce insured conventional corn over Bt or conventional corn with insurance. At the point of transfer from a risk-neutral producer to a risk-averse producer, there is evidence that for all but the June planting date a producer will prefer to produce Bt corn over insured corn. As the planting dates become later, the dominance of Bt over conventional corn becomes greater for the risk-loving producer as well as for the risk-averse producer. Also, as the corn is planted later, the crossover point from a Bt preference to an insurance preference becomes closer and closer to the risk-neutral point, until for the June planting date this point is on the risk-loving side of the graph.
Work with other specialty crops is ongoing. There have been three different surveys developed to look at white wheat. The first is a survey to wheat millers asking them about both red and white wheat. The survey attempts to gauge millers' purchase intentions of white wheat, how much price premium is involved, and how white wheat is purchased.
The second survey about white wheat is a survey to farmers already growing white wheat. This survey attempts to find out the price premiums farmers are receiving as well as estimates of their costs of production.
The third survey is a general interest survey to farmers in the Kentucky Farm Business Analysis program. This survey asks farmers about their interest in growing white wheat and other specialty crops. Currently, all the surveys are in the analysis stage.
Ibendahl, G., K. Zeuli, and W. Pearce. "Analyzing the Profitability and Risk of High-Oil Corn." No 2000-10. Department of Agricultural Economics, University of Kentucky. Lexington, Kentucky: June 2000.
Tim Woods and Matt Ernst, Department of Agricultural Economics
Edamame was in early stages of consideration as an alternative for tobacco production in 2000. Edamame was targeted as one crop with market potential and production feasibility by the New Crop Opportunities Center. At the same time, several Kentucky producers led the way in promoting development of a niche market for edamame in Kentucky. This report will highlight market research and development efforts funded through the New Crop Opportunities Center at the University of Kentucky while identifying challenges in the process to develop markets for edamame and other new crops.
Edamame (green vegetable soybean) is a name often applied to several specialty varieties of soybean (Glycine max). Edamame is a popular vegetable in Asia, where it is harvested and eaten in its green stage. The popularity of edamame in America has grown due to an increased preference for Asian American cuisine (1). Edamame has also benefited from the recent explosion in the market for health foods, especially soyfoods (2 ).
Test plots of two edamame varieties (ISTNL 2025 and ISTNL 2027) developed at Iowa State University were raised in the Owensboro area in 1998 and 1999 (McNulty, 2001) (3). In 2000, the Kentucky Department of Agriculture and Kentucky Soybean Board sponsored several edamame test plots in Western Kentucky. These beans were marketed through local farmers' markets and specialty produce stores. Several hundred pounds of edamame were also sold through a Cincinnati-based produce broker and distributed to area retail supermarkets. Elsewhere in Kentucky, other varieties of organically grown edamame were retailed at the Louisville Farmers' Market by Central Kentucky farmers.
Seeking to expand their local niche market and explore more widespread marketing opportunities, two Owensboro-area producers were awarded almost $10,000 in a 2001 Southern Region Sustainable Agriculture Research and Education (SARE) Producer Grant. The grant was used for promoting and marketing edamame soybeans in Kentucky (4). The producers' desire was to create a local niche for a fresh edamame product and then to promote edamame as a tobacco alternative.
The Owensboro producers worked with Tim Woods and Matt Ernst, collaborating with the New Crop Opportunities Center at the University of Kentucky, to explore consumer taste preferences for different edamame varieties and preparations. Detailed enterprise budgets were prepared to estimate producer returns and to estimate budget changes with various cost assumptions. Enthusiastic reception to edamame from consumers in Owensboro, Kentucky, and Evansville, Indiana, led to additional funding from SARE in 2002. Martha Lee, Family and Consumer Sciences Extension Agent for Daviess County, received an additional $8,712 Sustainable Community Innovations Grant to fund additional educational materials, Web site development <www.edamame.org>, and educational programs dedicated to promoting Kentucky edamame.
In spite of significant consumer education and promotional funding, the amount of edamame marketed annually in Kentucky has not expanded. Total Kentucky acreage remains under 15 acres with significant acreage occurring only on five farms. The remainder of this report is devoted to summarizing successes and challenges for new crop market development in Kentucky using examples from the experience with edamame. Recommendations for continued market development efforts will be made at the end of this report.
Several challenges have been encountered while exploring edamame production and marketing in Kentucky. These have included both successes and failures in the process of market development for this niche crop. Market development based on profitability versus passion for the product; facilitating market-oriented production research and developing proper market channels; attention to postharvest handling; and conducting basic consumer research were all experienced in varying degrees of success in this project.
Agricultural entrepreneurs, like other entrepreneurs, are often deeply passionate about their business endeavor and enthusiastic about their product. Successful entrepreneurs are also highly concerned about profits, including capturing profits due to early adoption/production of a new crop. Producers of edamame in Kentucky are characterized by one or both of these traits. In addition, those interested in edamame production in Kentucky were looking solely at the fresh edamame market. This market is thinly traded, often yielding spectacular prices that probably would not hold up with greater volume supplied.
Critical to success for a new crop, especially in Kentucky's traditionally tobacco-dependent economy, is for that crop's champions to demonstrate the crop's competitive profitability with other high-value crops. For edamame, University of Kentucky Extension economists were unable to justify estimated returns much over $300 in both 2000 (see Table 1) and 2001 (Appendix 1). These budget estimates indicated break-even prices upwards of $22 per 20 to 25 pound box of fresh edamame—considerably higher than current frozen wholesale edamame prices. This high break-even price is due to high labor costs for both harvesting and packing fresh market edamame. Thus, some public and research enthusiasm for the crop's fresh market was quelled until more efficient mechanical harvest options could be explored. Cost estimates to develop a frozen product still remained to be explored at this report's preparation.
One unique aspect of some new crops, notably edamame, is the presence of health and other external benefits. Producers growing edamame for the fresh market were all deeply convinced of the crop's market potential based on demonstrated health benefits of soy. It is difficult to balance a crop with such demonstrated benefits with other, potentially more profitable crops. It is likely that current market prices do not reflect a strong demand for health attributes that remain largely unknown to most consumers. The possibility of increased demand due to health benefits remains, but it is an unrealistic task for a few small-scale producers to raise consumer awareness of these attributes and thereby influence market prices substantially.
One of the difficulties with new crop market research is that there are many potential market channels. These channels already exist for many new crops in Kentucky; however, the fresh markets are often centered on the East and West Coasts.
Pioneer producers of new crops in the Midwest and mid-South often do not begin production by realizing any of these mainstream channels. Before entering existing market channels, pioneer producers need to be educated about the channel marketing requirements such as packaging, cooling, quality, distribution, labeling, etc.
Viable market channels identified for edamame were fresh on-farm retail, fresh farmers' market retail, fresh organic farmers' market retail, fresh wholesale, and frozen. The only channel that was being significantly explored by the beginning producers was the farmers' market. This was largely because of limited volume, limited access to adequate postharvest handling facilities, and limited marketing resources.
An additional challenge encountered during the edamame project involved lack of experience for cooperating markets in handling this product. Broker and wholesaler education activities may also be necessary for new crop handling. Research questions such as fresh or frozen market product potential may be included in varieties selected for research and trial. These experiences with edamame thus illustrated that attention to markets is critical at every stage of the new crop development process.
A sensory taste panel of consumers was constructed to evaluate various attributes of fresh and frozen edamame (5). The objectives of this taste panel were to: 1) measure consumer acceptance of a new vegetable crop and 2) begin to determine consumer use and willingness to pay for edamame. Financial support for the taste panel was provided from the New Crop Opportunities Center at the University of Kentucky.
Panelists were recruited through advertisement of the taste panel at the University of Kentucky and through publicity at the Good Foods Co-op in Lexington, Kentucky. Consumers were asked to evaluate three types of edamame beans: a frozen Kentucky bean (variety ISTNL 2027); a fresh Kentucky bean (commercial variety); and a frozen, in-pod bean (Seapoint Farms) obtained at a local retail store.
Both frozen beans were prepared in a microwave oven in the manner recommended on the commercial package (heat in water on high setting for 3 to 5 minutes). Fresh beans were also heated at the same setting, but for 30 seconds less than the frozen beans. Beans were prepared for the 58 panelists throughout the day in order to maintain fresh samples.
Panelists were first asked to fill out information so that they could be compensated $15 for their participation in this project. They were then asked to smell a sample of bean curd in order to define the term "beany" for use on the survey.
Panelists were then asked to evaluate the three in-pod samples of edamame. They were asked to individually rank the samples based on appearance, texture, flavor, and overall preference. They were also asked to rank these criteria in order of preference in relation to one another.
Finally, panelists were asked to evaluate two samples of a prepared salad dish, one sample prepared with and one sample prepared without, edamame. The last questions of the survey involved a brief measurement of the willingness to pay for fresh and frozen edamame products and experience in eating soy and other edamame products.
Panelists indicated that the commercial frozen product was the most difficult to remove the beans from the pods, while the frozen Kentucky product was the easiest to remove the beans. While only half the panelists had eaten edamame before, no panelist commented that the beans were exceptionally difficult to separate from the pod.
Overall, 65% of the panelists said they preferred the fresh Kentucky and frozen commercial products over the frozen Kentucky product (Figure 1). However, very few of the panelists (3.4%) "disliked extremely" or "disliked" the frozen Kentucky product when asked to evaluate it alone. This stands in contrast to the percentage of panelists who "disliked extremely" or "disliked" the fresh Kentucky edamame (5.2%) and the commercial frozen edamame (10.3%).
Flavor and texture were also evaluated by the panelists. These results are reported below in Table 2. The commercial frozen product was definitely ranked as the "least mushiest" while the frozen Kentucky product was ranked as the "mushiest." The panelists did not generally associate a "beany" flavor with the sampled edamame beans.
The responses to the two samples of the salad made with and without edamame are inconclusive. People really enjoyed the salad, but its composition was too heterogeneous for them to notice the absence of edamame in the first sample.
Panelists were also asked some questions regarding their acceptance of edamame. While only half the panelists had experience in eating edamame, about three-fourths responded that they would be interested in the vegetable as an ingredient in soups and salads. There was also significant interest in other uses of edamame, summarized below in Table 3.
Panelists indicated that they would be willing to pay more for a frozen, out-of-pod bean. Most panelists indicated they were willing to pay no more than $2.50 for a pound of fresh product (Table 4). This price is lower than the current price being paid ($2.50 to $4.00 per pound) for the limited volume of fresh edamame sold in Kentucky. It is quite possible that there exists a sample bias including fewer "health oriented" consumers, those willing and able to pay more for a healthy product like edamame. A follow-up study conducted at a health foods store or farmers' market would likely reach a group with higher willingness to pay. The relative differences between the categories, however, is still informative.
Overall, panelists were enthusiastic about edamame. Very few "disliked" or "disliked extremely" any of the varieties tested. Many of the panelists who had not tasted edamame before inquired where they could buy this product. Several were interested in obtaining recipes utilizing edamame.
The difference between the price consumers are willing to pay for fresh edamame and the price being currently paid at farm markets indicates that fresh market prices will indeed decrease as supply increases. Budget estimates indicate that there is plenty of room for producer profits at retail prices of $2.50 per pound, the maximum many panelists indicated they were willing to pay per pound of fresh edamame. Producers marketing locally should always bear in mind that they may adjust their asking price to what the market will support.
There is a need for additional edamame variety development and testing in Kentucky. Efforts in postharvest handling are also crucial to developing a fresh edamame industry. However, this early, cursory measure of consumer response to edamame continues to indicate outstanding potential for additional fresh market edamame development in Kentucky.
Additional consumer sensory work for edamame in Kentucky may involve both larger and smaller consumer panels, including trained panels. Consumer analysis of different varieties, as well as an evaluation of different cooking methods and processes, will be needed for more complete market development. Considerations for future consumer panels might include smaller focus groups, comparison of consumer responses to distinctly different varieties, and evaluation of edamame in different kinds of prepared dishes.
To conclude, there are three areas that the experience with edamame in Kentucky suggests are of considerable importance for future development of new crops. These are consumer research, utilizing existing market channels, and producer-led promotion.
Publicity for a new, agriculturally based product can sometimes be difficult. Farm entrepreneurs exploring a new commodity, such as edamame, rarely have the capital to conduct serious market promotion and research in their area. Packing, storage, and distribution costs, typically unique for each marketing channel, can also be prohibitive.
Estimating consumer demand and preferences for relatively unknown products is also a challenge. Kentucky producers exploring edamame utilized researchers and facilities at the University of Kentucky to conduct an objective consumer sensory evaluation of edamame. A producer-led initiative to obtain objective consumer input about a new product is key for the crop's development. Working with university and consumer groups has been a good way for edamame enthusiasts to obtain consumer demand information that can help them better market the product.
Rather than develop an entirely new market channel for a given product, agricultural entrepreneurs find it effective to utilize existing market channels already being used for similar products. It is typically costly to develop and enter a new market channel and can become prohibitive for someone operating independently on a small scale. Early edamame marketing in Kentucky has utilized many existing outlets including farmers' markets, specialty produce retailers, farm stands, and produce brokers but has not really pursued any of these markets on a large scale. Like other new or niche agricultural products, a lot remains unknown about edamame market channels in Kentucky and surrounding areas.
Producers have led the way for edamame promotion in Kentucky. A professionally designed marketing brochure entitled "Kentucky Edamame" was created in 2001 through a producer-led effort. Many promotional cooking demonstrations and other educational events about edamame are also being conducted with great success in the Owensboro/Evansville area.
Such producer-driven promotional efforts make producers true marketers of a new crop. Enthusiastic, producer-driven marketing continues to be essential if producers of new crops such as edamame wish to capture increased profits for their entrepreneurial efforts.
Early experiences with edamame in Kentucky demonstrate the importance of attention to marketing from the beginning of the new crop development process. As of early July 2001, it appeared that a niche for fresh market edamame was being carved out in the Owensboro/Evansville area.
Break-even costs for edamame grown for the fresh market range from $16 to $25 per 20 to 25 pound box of in-pod edamame. There already exist a number of attractive, but small, niche markets for direct-to-consumer sales in Kentucky. Sensory and willingness-to-pay tests with consumers revealed a generally positive perception of and reaction to edamame. Consumers were willing to pay slightly more for the shelled product, even frozen, compared to the fresh product in pod. The frozen market, however, is highly competitive. Imports from Asian markets can be readily found in many larger U.S. markets and sell for approximately $1.00 to $2.00 per pound depending on geographic region.
The opportunity to develop various fresh products with edamame grown in Kentucky, however, seems quite promising. Producers would face limited competition and find generally willing markets for regional distribution. Volume and postharvest handling, however, will be necessary to make Kentucky an attractive supply source for serious buyers of fresh market edamame.
Finally, producers simply must be willing to make significant capital investments to increase production efficiency and develop postharvest handling and marketing procedures. If this willingness and capital are available, there is significant potential for increased farm profits from fresh (and perhaps frozen) edamame production and marketing in Kentucky and surrounding areas.
Special thanks to Kenny Burdine, Agricultural Economics, who reviewed this article in its entirety. Thanks also to Sara McNulty (Producer); Martha Lee (Daviess County Extension); Sandra Bastin and Janet Tietyen (Family and Consumer Sciences); and Betty King (Leadership and Community Development), who reviewed portions of this article.
| Table 1. Estimated return per acre to land and management for Kentucky crops, 2000. | |
| Crop | Estimated Return |
| Sweet Corn | $135 |
| Pumpkins | $243 |
| Edamame (wholesale fresh market) | $259 |
| Staked Tomatoes | $715 |
| Cantaloupe | $1,113 |
| Burley Tobacco | $1,541 |
| Source: University of Kentucky Department of Agricultural Economics. Assumes average yields and prices with no drought conditions. Assumes irrigation and hand harvest for edamame, cantaloupe, pumpkins, and tomatoes. Assumes irrigation and machine harvest for sweet corn. Tobacco return includes settlement income and assumes no lease purchases are required to produce a crop. | |
| Table 2. Overall flavor and texture rankings (number of panelists responding). | ||||||
| Mushiest | Second Mushiest | Least Mushiest | Beaniest | Second Beaniest | Least Beaniest | |
| Frozen Kentucky | 44 | 7 | 6 | 22 | 10 | 21 |
| Fresh Kentucky | 8 | 37 | 10 | 10 | 30 | 16 |
| Frozen commercial | 4 | 10 | 40 | 23 | 13 | 18 |
| No response | 2 | 4 | 2 | 3 | 5 | 3 |
| Table 3. Uses for edamame appealing to panelists. | ||
| Number Interested | Percent | |
As an ingredient in salads or as a salad topper |
47 | 81% |
| As a soup ingredient | 43 | 74% |
| As a stand-alone vegetable | 34 | 59% |
As a substitute for lima beans or other similar vegetables |
33 | 57% |
As a salted snack (like peanuts) to be consumed with your choice of beverage |
27 | 47% |
| Table 4. Consumer willingness to pay for 1 pound edamame. | ||
| Price Range | No. Willing to Pay for In-Pod Fresh Edamame | No. Willing to Pay for Frozen, Shelled Edamame |
| $0.50-$1.50 | 20 | 8 |
| $1.51-$2.50 | 26 | 24 |
| $2.51-$3.50 | 8 | 18 |
| $3.51-$4.50 | 0 | 6 |
| >$4.50 | 1 | 0 |
| No response | 3 | 2 |
| Green Edible Soybeans Kentucky Estimated per Acre Costs and Returns for 2001 | |||||||
| Wholesale Produce Market | |||||||
| Quantity | Unit | $/Unit | Total | ||||
| GROSS RETURNS | |||||||
| Fresh soybeans (boxes) | 450 | boxes | $24.50 | $11,025.00 | a | ||
| VARIABLE COSTS | |||||||
| Production | |||||||
| Seed | 1 | acre | $21.00 | $21.00 | b | ||
| Fertilizer: 3-15-40 | 300 | lb | $0.09 | $26.16 | b | ||
| Pesticide | 1 | qt | $5.85 | $5.85 | c | ||
| Miscellaneous | 1 | acre | $8.00 | $8.00 | |||
| Machinery Variable Costs | 1 | acre | $14.76 | $14.76 | d | ||
| Hand Labor—Cultivating | 95 | hours | $7.00 | $665.00 | f | ||
| Interest on Preharvest Variable Costs | 8 | months | 9% |
$44.45 | |||
| Total Preharvest Variable Costs | $785.22 | ||||||
| HARVESTING AND MARKETING | |||||||
| Pick, Sort, Grade Beans | 1 | box | $15.50 | $6,975.00 | |||
| Boxes | 450 | boxes | $1.66 | $749.21 | |||
| Handle and Hauling Variable Costs | 450 | boxes | $0.05 | $22.50 | e | ||
| Marketing Charge | 450 | boxes | 10% |
$1,102.50 | |||
| Variable Refrigeration Costs (electricity, maintenance, etc.) | $450.00 | $450.00 | |||||
| Total Harvesting and Marketing Cost | $9,299.21 | ||||||
| TOTAL VARIABLE COST | $10,084.43 | ||||||
| RETURN ABOVE VARIABLE COSTS | $940.57 | ||||||
| FIXED COSTS | |||||||
| Machinery and Equipment | $61.72 | d | |||||
| Taxes on Land | $4.00 | ||||||
| Insurance | $55.13 | ||||||
| Refrigeration | $657.00 | ||||||
| TOTAL FIXED COSTS | $777.85 | ||||||
| TOTAL EXPENSES | $10,862.27 | ||||||
| RETURN TO OPERATOR LABOR, LAND, CAPITAL & MANAGEMENT | $162.73 | ||||||
| Operator and Unpaid Family Labor | 2.25 | hours | $8.00 | $18.00 | |||
| RETURN TO LAND, CAPITAL, AND MANAGEMENT | $144.73 | ||||||
| BREAK-EVEN PRICE | $24.14 | ||||||
| a | Estimated average yield from various Kentucky test plots in 2000. Price based on limited quantity sold in 2000. | ||||||
| b | Input prices from Western Kentucky. | ||||||
| c | Assumes use of Prowl or similar herbicide. | ||||||
| d | Machinery costs based on 2000 Iowa State estimated machinery costs adjusted to Kentucky and vegetable production. | ||||||
| e | Includes a 24-hour cooling cost. Budget assumes operation has existing refrigeration capacities. | ||||||
| f | Best yielding plot in Kentucky utilized hand cultivation. This budget assumes adequate labor availability. Machine cultivation will reduce labor costs at some yield and quality loss but may increase returns significantly. | ||||||
| g | Estimated annual cost of refrigeration maintenance; assumes soybeans as sole crop refrigerated. | ||||||
| Prepared by Matthew Ernst, Extension Associate, New Crop Opportunities Center/UK Department of Agricultural Economics with assistance from Sara McNulty, Wildwood Acres, Owensboro, Kentucky. | |||||||
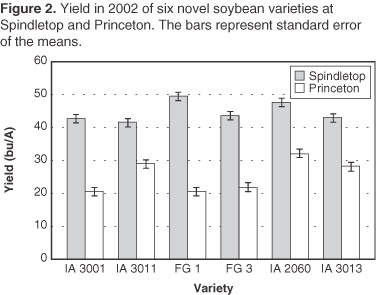
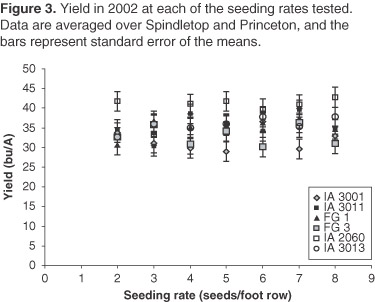
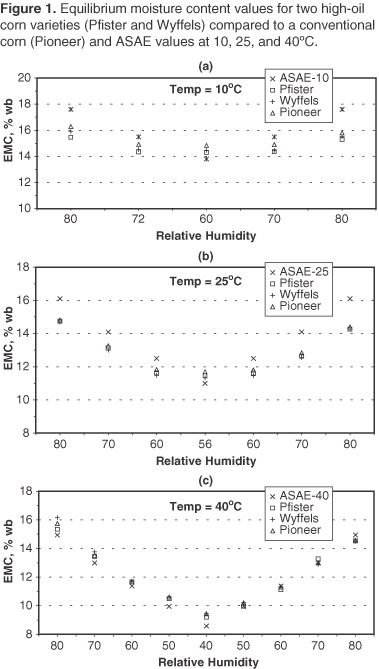
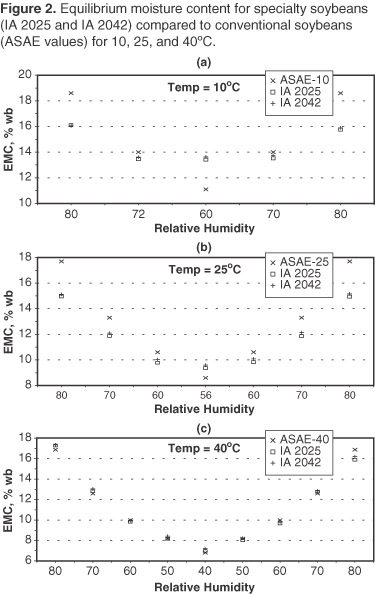
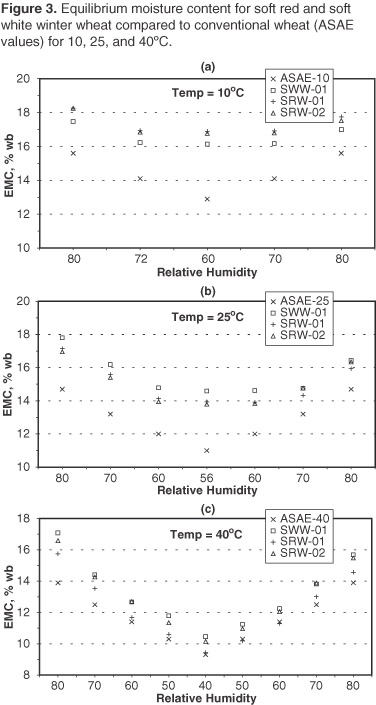
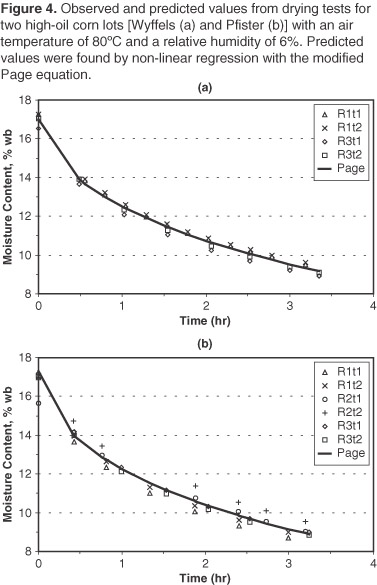
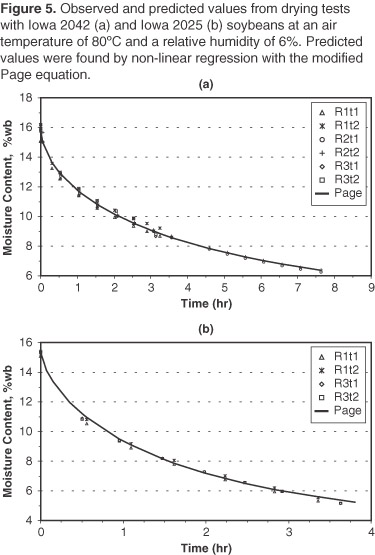
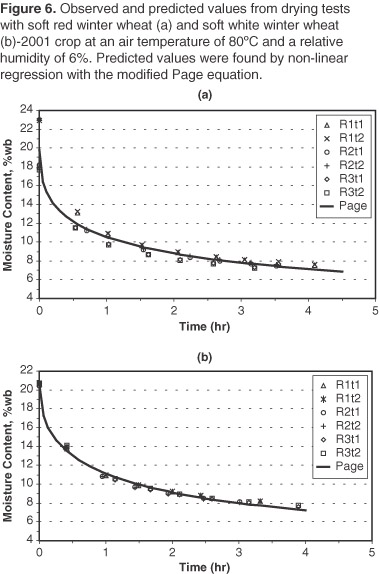
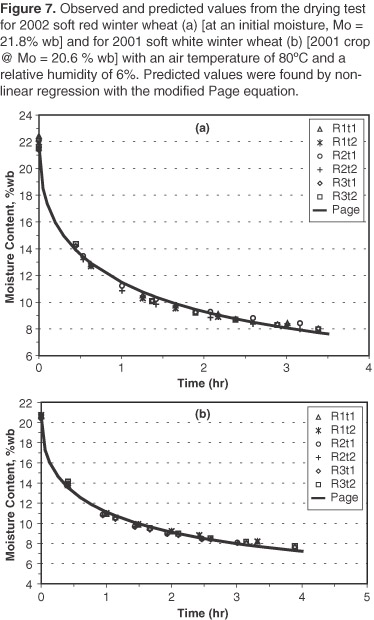